Moses’s MACD Singapore Stock Scan – January 3, 2012
Happy New Year! Wishing you and your loved ones a healthy, wealthy and joyful 2012 ahead.
Welcome!
Welcome to AmiBrokerAcademy.com free MACD Singapore stock scan. My name is Moses. I will be your host for 2012. I will be running this MACD scan as often as I can. This scanner will run on a daily basis to help traders filter the stocks that are listing in Singapore. Of course, I will also do stock analysis.
The MACD scan here will only identify stocks that have MACD bullish or bearish signal. The scanner will only pick those stocks that have volume greater than 100K and have stock price more than a dollar.
Potentially for stocks that have bullish or bearish MACD signal could move in the near term. The signal will be correct till it is being proven wrong.
Our stock scanner was from TerraSeeds. It was for their training purpose. The script is written by AmiBroker AFL based upon the MACD indicator rules.
MACD is a popular technical indicator that identifies trend and potential reversal.
The benefit of any scanner is it replaces the human effort in reviewing the stock one at a time. It only takes a few minutes for the screener script to go through the entire database which contains nearly 1000 equities listed in Singapore Stock Exchange. Compare it to a manual effort, assuming if it only takes 5 minutes per stock, with 1000 stocks to review. It will be 5000 minutes in this case. It will equal to 83 plus hours which means nearly 3 and a half days. Wow!
For those we do not know what MACD is.
Moving Average Convergence Divergence, MACD
MACD was developed by Gerald Appel in the late seventies.
- MACD stands for Moving Average Convergence Divergence, the MACD line (red line or called fast line) and MACD signal line (blue line, or called slow line).
- MACD Bullish Signal Line Cross: MACD bullish signal when red line crosses above the blue line or MACD line crosses above zero line.
- MACD Bearish Signal Line Cross: MACD bearish signal when blue line crosses below red line or MACD line crosses below zero line.
MACD Scan
There are 17 stocks picked for today. The following are the 17 stocks that passed our selection criteria for MACD scan script that closed on January 3, 2012. These stocks are volume exceeding 100K and price above one dollar.
Out of 18 stocks there are 16 stocks that have bullish MACD signal and only 1 stock that have bearish MACD signal.
| Company | Type | Close | Vol.(K) | Screening Result |
| GENTING SINGAPORE PLC | bullish |
1.565 |
47431 |
MACD Cross-Up ZeroLine |
| NOBLE GROUP LIMITED | bullish |
1.16 |
31041 |
MACD Cross-Up Signal |
| HYFLUX LTD | bullish |
1.305 |
9726 |
MACD Cross-Up ZeroLine |
| SINGTEL | bullish |
3.14 |
9556 |
MACD Cross-Up Signal |
| YANLORD LAND GROUP LIMITED | bullish |
1.005 |
9276 |
MACD Cross-Up Signal |
| STX OSV HOLDINGS LIMITED | bullish |
1.2 |
7980 |
MACD Cross-Up Signal |
| OLAM INTERNATIONAL LIMITED | bullish |
2.17 |
7725 |
MACD Cross-Up Signal |
| STRAITS ASIA RESOURCES LIMITED | bullish |
1.89 |
6271 |
MACD Cross-Up Signal |
| ASCENDAS REAL ESTATE INV TRUST | bullish |
1.855 |
4699 |
MACD Cross-Up Signal |
| OVERSEA-CHINESE BANKING CORP | bullish |
7.91 |
2377 |
MACD Cross-Up Signal |
| OVERSEAS UNION ENTERPRISE LTD | bullish |
2.14 |
1872 |
MACD Cross-Up ZeroLine |
| SINGAPORE EXCHANGE LIMITED | bullish |
6.19 |
878 |
MACD Cross-Up ZeroLine |
| HONGKONG LAND HOLDINGS LIMITED | bullish |
4.72 |
653 |
MACD Cross-Up Signal |
| KEPPEL TELE & TRAN | bullish |
1.13 |
427 |
MACD-H +ve Divergence |
| CDL HOSPITALITY TRUSTS | bullish |
1.58 |
248 |
MACD Cross-Up Signal |
| HONG LEONG ASIA LTD. | bullish |
1.615 |
242 |
MACD Cross-Up ZeroLine |
| FORTUNE REAL ESTATE INV TRUST | bearish |
3.75 |
247 |
MACD-H -ve Divergence |
Straits Times Index, Singapore stock market benchmark, STI for market ended January 3, 2012
O = 2646.35 points
C = 2688.36 points
H = 2693.23 points
L = 2646.35 points
Singapore stock market opens strong after the New Year holiday break. The market is very active. It is bullish. This is generally true for the Asia market. The Straits Times Index, Singapore stock market benchmark, STI closed at 2688.36 points. It is 42.01 points higher than the last year market closed.
This is a good start for 2012. 2012 has being forecasted to be a slow or sideways year. This will be valid till it is being proven wrong. Everyone will like the forecast to be wrong. However, it is too early at this point. We have three hundreds plus days to go. Will see.
Straits Times Index Daily Chart, for market ended January 3, 2012
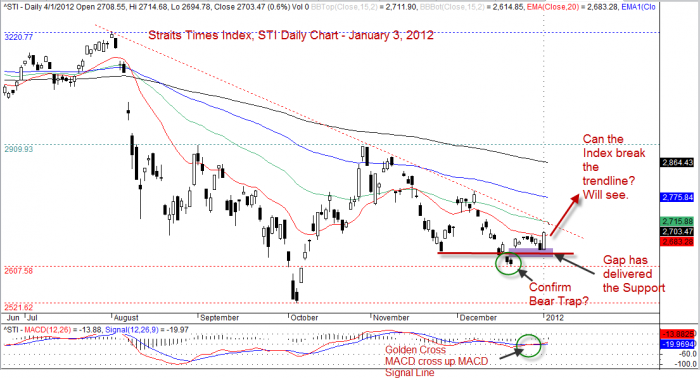
Straits Times Index, STI Daily Chart - Day End January 3, 2012
By Moses
DSICLAIMER
Information provided here is of the nature of a general comment only and no intend to be specific for trading advice. It has prepared without regard to any particular investment objectives, financial situation or needs. Information should not be considered as an offer or enticement to buy, sell or trade.
You should seek advice from your broker, or licensed investment advisor, before taking any action.
Once again, the website does not guarantee any results or investment return based on the information and instruction you have read here. It should be used as learning aids only and if you decide to trade real money, all trading decision should be your own.
These are script generated signals. Not all scan results are shown here. The MACD signal should use with price action. Users must understand what MACD and price action are all about before using them. If necessary you should attend a course to learn more on Technical Analysis (TA) and Moving Average Convergence Divergence, MACD.
Leave a Reply
You must be logged in to post a comment.