Moses’s MACD Singapore Stock Scan – January 16, 2012
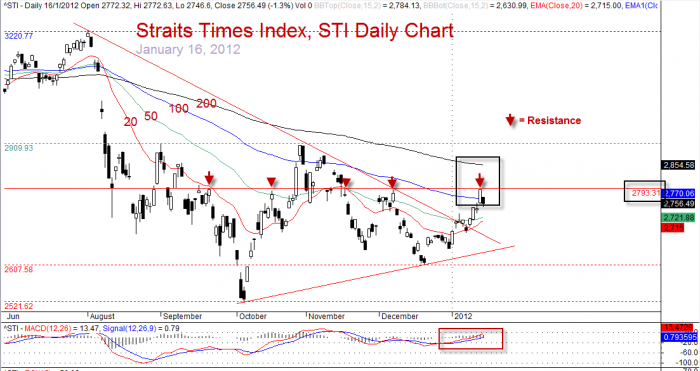
Welcome to Moses’s Stock Scan Conner at AmiBrokerAcademy.com. This is January 16, 2012 top 20 volume that have MACD bullish signal or bearish signal. The market benchmark, Straits Times Index closed at 2756.49 points, 35.05 points lower than the last closed.
Fundamental
Some observers would say this is the effect from Eurozone debt crisis, the credit rating downgrade by Standard & Poor’s (S&P) for some Europe nations such as France and Austria to AA+ and so on. True? Inevitable the traders and investors will be affected by such news one way or the other.
Technical Analysis
From the chart we can see the index is facing a possible resistance at 2793 level. The price action or index action will respect the a major support and resistance. So, the fall of the STI from the TA standpoint is not surprising. Trade what you see. Trade with caution.
January 16, 2012 MACD Scan Results
Out of 20 stocks, 7 stocks have bullish MACD signal and 13 stocks have bearish MACD signal. These are script generated results.
| Company | type | Close | Vol.(K) | Screening Result |
| NOBLE GROUP LIMITED | bullish |
1.11 |
44273 |
MACD Cross-Up Signal |
| GENTING SINGAPORE PLC | bearish |
1.515 |
39832 |
MACD Cross-Down Signal |
| SINGTEL | bearish |
3.12 |
18012 |
MACD Cross-Down ZeroLine |
| NEPTUNE ORIENT LINES LIMITED | bearish |
1.235 |
8905 |
MACD-H -ve Divergence |
| COSCO CORPORATION (S) LTD | bearish |
0.97 |
7147 |
MACD-H -ve Divergence |
| SKY ONE HOLDINGS LIMITED | bearish |
0.127 |
3075 |
MACD-H -ve Divergence |
| SINGAPORE POST LIMITED | bullish |
0.95 |
1886 |
MACD Cross-Up ZeroLine |
| XINREN ALUMINUM HOLDINGS LTD | bearish |
0.285 |
1790 |
MACD Cross-Down Signal |
| STARHUB LTD | bearish |
2.88 |
1608 |
MACD Cross-Down Signal |
| FRASER AND NEAVE | bearish |
6.33 |
1145 |
MACD -ve Divergence |
| EZION HOLDINGS LIMITED | bearish |
0.695 |
1143 |
MACD -ve Divergence |
| AMTEK ENGINEERING LTD | bearish |
0.635 |
977 |
MACD-H -ve Divergence |
| RAFFLES EDUCATION CORP LTD | bearish |
0.425 |
855 |
MACD Cross-Down Signal |
| UE E&C LTD. | bullish |
0.39 |
582 |
MACD Cross-Up Signal |
| SUPER GROUP LTD. | bullish |
1.405 |
572 |
MACD Cross-Up ZeroLine |
| MEIBAN GROUP LTD | bearish |
0.28 |
393 |
MACD -ve Divergence |
| CHINA AVIATION OIL(S) CORP LTD | bearish |
1.05 |
236 |
MACD-H -ve Divergence |
| CHUAN HUP HOLDINGS LIMITED | bullish |
0.21 |
200 |
MACD Cross-Up Signal |
| ABTERRA LTD | bullish |
0.755 |
179 |
MACD Cross-Up ZeroLine |
| SAPPHIRE CORPORATION LIMITED | bullish |
0.135 |
160 |
MACD Cross-Up ZeroLine |
Straits Times Index, STI Daily Chart
Straits Times Index, STI Daily Chart
See other post on Straits Times Index.
By Moses, January 17, 2012
DSICLAIMER
Information provided here is of the nature of a general comment only and no intend to be specific for trading advice. It has prepared without regard to any particular investment objectives, financial situation or needs. Information should not be considered as an offer or enticement to buy, sell or trade.
You should seek advice from your broker, or licensed investment advisor, before taking any action.
Once again, the website does not guarantee any results or investment return based on the information and instruction you have read here. It should be used as learning aids only and if you decide to trade real money, all trading decision should be your own.
These are script generated signals. Not all scan results are shown here. The MACD signal should use with price action. Users must understand what MACD and price action are all about before using them. If necessary you should attend a course to learn more on Technical Analysis (TA) and Moving Average Convergence Divergence, MACD.
Leave a Reply
You must be logged in to post a comment.