February 12, 2018
Yesterday, we told you we are pattern trader. We said, may be there is a similarity for the ST Index.
See the chart in this posting this is what we mean. Have fun learning.
Powerful Chart Software – AmiBroker
The following chart is produced using AmiBroker charting software. It is a powerful chart software. You plot the stocks you are interested all in one chart, as long as you still could read them. See chart below. Thereafter slowly climb up, step by step.
The only possible that may come close in TA is Fibonacci and HM Gartley.
^STI Straits Times Index Charting and Possible History Repeat Itself
We told you to go and look further left, now we are going to show you what we mean on the possible history might repeat itself.
Have fun!
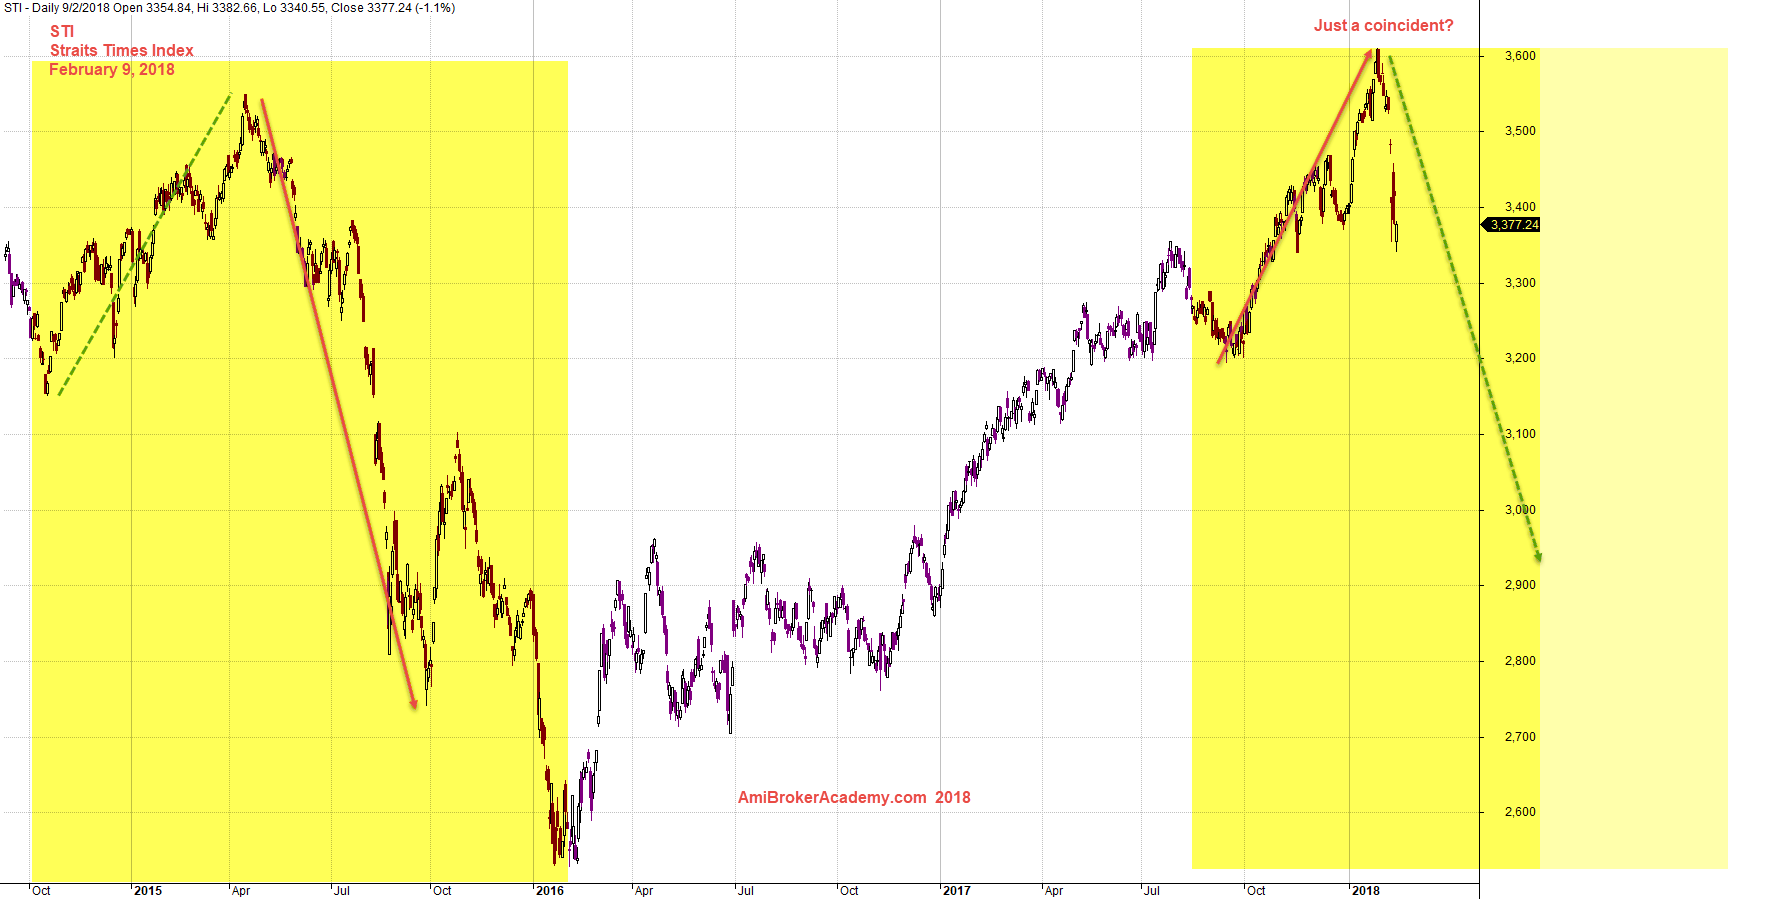
February 9, 2018 Straits Times Index and History May Repeat Itself Again
Moses
AmiBrokerAcademy.com
Disclaimer
The above result is for illustration purpose. It is not meant to be used for buy or sell decision. We do not recommend any particular stocks. If particular stocks of such are mentioned, they are meant as demonstration of Amibroker as a powerful charting software and MACD. Amibroker can program to scan the stocks for buy and sell signals.
These are script generated signals. Not all scan results are shown here. The MACD signal should use with price action. Users must understand what MACD and price action are all about before using them. If necessary you should attend a course to learn more on Technical Analysis (TA) and Moving Average Convergence Divergence, MACD.
Once again, the website does not guarantee any results or investment return based on the information and instruction you have read here. It should be used as learning aids only and if you decide to trade real money, all trading decision should be your own.