March 28, 2017
Singapore Stocks MACD signals. Free Singapore Stock MACD Scan for Trading Day Close March 23, 2017
Welcome to Moses’s Stock Scan at AmiBrokerAcademy.com.
The following are one-day MACD scan on Singapore Stocks listed with SGX done with Amibroker using MACD Screening Script. This stock screening narrow it to stocks with a minimum value of one dollar with at least 1,000,000 shares changed hands.
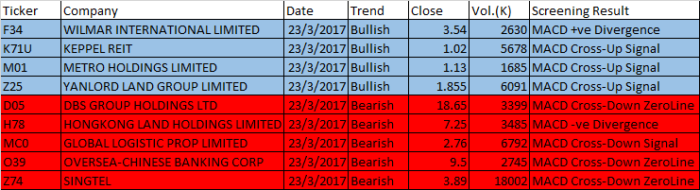
March 23, 2017 Singapore Stock Screening Signals
| Ticker | Company | Date | Trend | Close | Vol.(K) | Screening Result |
| F34 | WILMAR INTERNATIONAL LIMITED | 23/3/2017 | Bullish | 3.54 | 2630 | MACD +ve Divergence |
| K71U | KEPPEL REIT | 23/3/2017 | Bullish | 1.02 | 5678 | MACD Cross-Up Signal |
| M01 | METRO HOLDINGS LIMITED | 23/3/2017 | Bullish | 1.13 | 1685 | MACD Cross-Up Signal |
| Z25 | YANLORD LAND GROUP LIMITED | 23/3/2017 | Bullish | 1.855 | 6091 | MACD Cross-Up Signal |
| D05 | DBS GROUP HOLDINGS LTD | 23/3/2017 | Bearish | 18.65 | 3399 | MACD Cross-Down ZeroLine |
| H78 | HONGKONG LAND HOLDINGS LIMITED | 23/3/2017 | Bearish | 7.25 | 3485 | MACD -ve Divergence |
| MC0 | GLOBAL LOGISTIC PROP LIMITED | 23/3/2017 | Bearish | 2.76 | 6792 | MACD Cross-Down Signal |
| O39 | OVERSEA-CHINESE BANKING CORP | 23/3/2017 | Bearish | 9.5 | 2745 | MACD Cross-Down ZeroLine |
| Z74 | SINGTEL | 23/3/2017 | Bearish | 3.89 | 18002 | MACD Cross-Down ZeroLine |
Four MACD Signals:
- Crossovers – Sell Strategy, MACD crosses below the signal line. Buy Strategy, MACD rallies above the signal line. It is advisable to wait for confirmation to reduce possible whipsaw.
- Divergence – The security price action diverges from the MACD. It signals the end of the current trend.
- Cross Zero Line – MACD moves above or below zero line. Upward trend: Cross above zero line, short MA above long MA. Downward trend: Cross below zero line, short MA below long MA.
- Dramatic rise or fall – MACD rises or decline dramatically – when the shorter moving average pulls away from the longer-term moving average – Oversold or Overbought.
Moses
AmiBrokerAcademy.com
Disclaimer
The above result is for illustration purpose. It is not meant to be used for buy or sell decision. We do not recommend any particular stocks. If particular stocks of such are mentioned, they are meant as demonstration of Amibroker as a powerful charting software and MACD. Amibroker can program to scan the stocks for buy and sell signals.
These are script generated signals. Not all scan results are shown here. The MACD signal should use with price action. Users must understand what MACD and price action are all about before using them. If necessary you should attend a course to learn more on Technical Analysis (TA) and Moving Average Convergence Divergence, MACD.
Once again, the website does not guarantee any results or investment return based on the information and instruction you have read here. It should be used as learning aids only and if you decide to trade real money, all trading decision should be your own.