Welcome!
Welcome to AmiBrokerAcademy.com free MACD Singapore stock scan. This scanner runs on a daily basis to help traders filter the stocks that are listing in Singapore. The MACD scan will identify stocks only have MACD bullish or bearish signal. Only for those stocks have volume greater than 100K and have price more than a dollar. Potentially those stocks have bullish or bearish MACD signal could move in the near term. The signal is correct till it is being proven wrong.
Our stock scanner is an AmiBroker AFL script written based on the MACD indicator. MACD is a popular technical indicator that identifies trend and potential reversal.
The benefit of a scanner is it replaces the human effort in reviewing the stock one at a time. It only takes a few minutes for the screener script to go through the entire database which contains nearly 1000 equities listed in Singapore Stock Exchange. Compare it with a manual effort, assuming if it only takes 5 minutes per stock, with 1000 stocks to review. It will be 5,000 minutes for 1,00o stocks. It will equal to 83 plus hours which means nearly 3 and a half days. Wow!
Moving Average Convergence Divergence, MACD
For those we do not know what MACD is. MACD was developed by Gerald Appel in the late seventies.
- MACD stands for Moving Average Convergence Divergence, the MACD line (red line or called fast line) and MACD signal line (blue line, or called slow line).
- MACD Bullish Signal Line Cross: MACD bullish signal when red line crosses above the blue line or MACD line crosses above zero line.
- MACD Bearish Signal Line Cross: MACD bearish signal when blue line crosses below red line or MACD line crosses below zero line.
How to trade with MACD signals?
The right approach is further analyzing the shortlisted stocks to determine the suitable entry and exit, and stop loss. Calculate the risk involved. The valid entry is MACD signal complete with price action confirmation.
MACD Scan
Today, there are 7 stocks picked for the day. The following are the 7 stocks that passed our selection criteria for MACD scan script that closed on 29 December 2011. These stocks are volume exceeding 100K and price action above one dollar.
Out of seven stocks there are four stocks that have bullish MACD signal and three stocks that have bearish MACD signal. The market is expected to continue to be weak. This is expected to be continued till the end of the festive holiday.
| Company | Type | Close | Vol.(K) | Screening Result |
| COMFORTDELGRO CORPORATION LTD | bullish |
1.43 |
1367 |
MACD Cross-Up Signal |
| WBL CORPORATION LIMITED | bullish |
2.76 |
100 |
MACD +ve Divergence |
| ABF SPORE BOND INDEX FUND ETF | bullish |
1.164 |
100 |
MACD +ve Divergence |
| GLOBAL LOGISTIC PROP LIMITED | bullish |
1.76 |
8343 |
MACD Cross-Up ZeroLine |
| TOTAL ACCESS COMM PUB CO LTD | bearish |
2.44 |
241 |
MACD Cross-Down Signal |
| MAPLETREE INDUSTRIAL TRUST | bearish |
1.08 |
448 |
MACD Cross-Down Signal |
| HONGKONG LAND HOLDINGS LIMITED | bearish |
4.58 |
1352 |
MACD Cross-Down ZeroLine |
Straits Times Index, Singapore stock market benchmark, STI for market ended December 29, 2011
O = 2661.79 points
C = 2672.78 points
H = 2672.78 points
L = 2655.62 points
The Straits Times Index, STI closed at 2672.78 points, 6.55 points higher than the last market closed. The index is continued to sideways with narrow range candlestick. The market will continue to have the festive mode. One more day to go will end the 2011.
Straits Times Index Daily Chart, for market ended December 29, 2011
The STI may be resisted by 20 days EMA and equal distance channel.
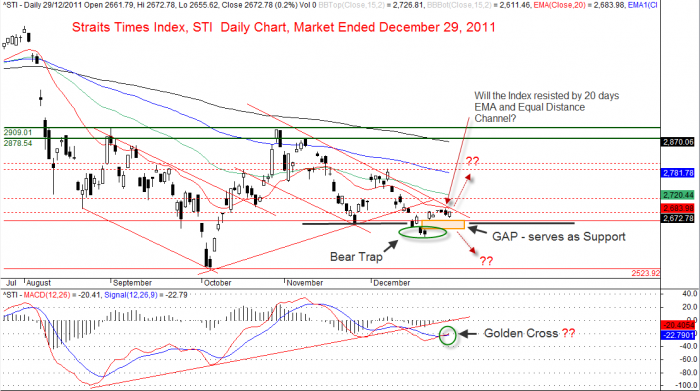
- Straits Times Index, STI Daily Chart for market ended December 29, 2011
DSICLAIMER
Information provided here is of the nature of a general comment only and no intend to be specific for trading advice. It has prepared without regard to any particular investment objectives, financial situation or needs. Information should not be considered as an offer or enticement to buy, sell or trade.
The above result is for illustration purpose. If particular stocks of such are mentioned, they are meant as demonstration of AmiBroker as a powerful charting software and MACD characteristics. AmiBroker can program to scan the stocks for buy and sell signals.
The MACD signal should use with price action. Users must understand MACD and price action before using them. If necessary you should attend a course to learn more on Technical Analysis (TA) and Moving Average Convergence Divergence (MACD).
You should seek advice from your broker, or licensed investment advisor, before taking any action.
Once again, the website does not guarantee any results or investment return based on the information and instruction you have read here. It should be used as learning aids only and if you decide to trade real money, all trading decision should be your own.
Leave a Reply
You must be logged in to post a comment.