July 16, 2017
The ST Index Chart Taken Before EOD
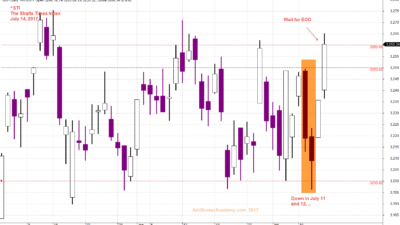
The following chart was taken before the day close. See the new chart below, it was taken on the Friday, July 14 close.

July 14, 2017 Straits Times Index and Key Levels
Straits Times Index and MACD Signals
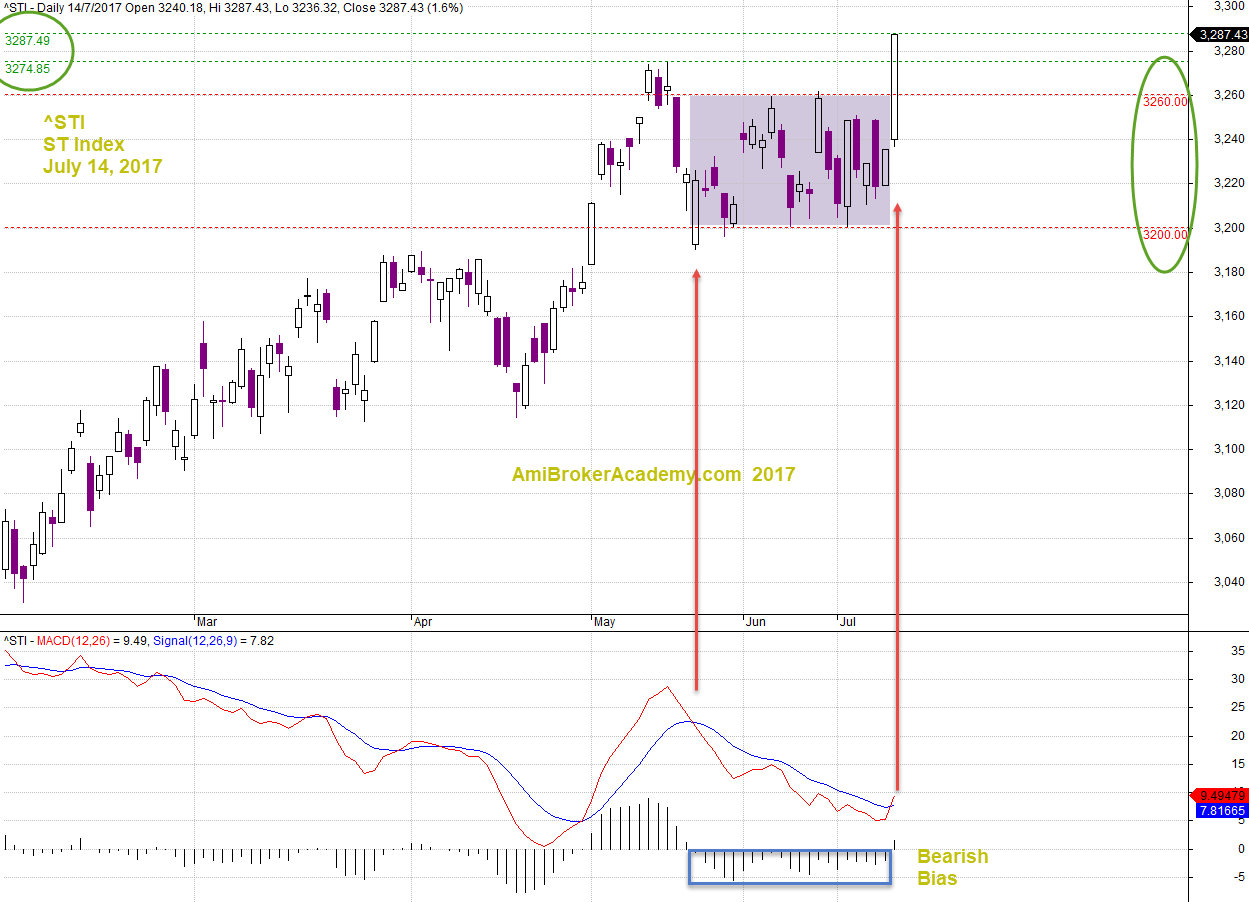
Picture worth a thousand words. See the different between the two charts below, on the last candle. The first chart the candle only touch 3260 level and the chart that followed the candle actually close on 3287.43 level. See, this why we always are you to wait for the day close before you conclude your trading plan.
The Key point here was to ask you to see the MACD indicator. You can see MACD shows the index is very much consider as bearish bias. This does not reflect on the candle chart, but MACD.
July 14, 2017 The Straits Times Index and MACD Indicator
Moses
AmiBrokerAcademy.com
Disclaimer
The above result is for illustration purpose. It is not meant to be used for buy or sell decision. We do not recommend any particular stocks. If particular stocks of such are mentioned, they are meant as demonstration of Amibroker as a powerful charting software and MACD. Amibroker can program to scan the stocks for buy and sell signals.
These are script generated signals. Not all scan results are shown here. The MACD signal should use with price action. Users must understand what MACD and price action are all about before using them. If necessary you should attend a course to learn more on Technical Analysis (TA) and Moving Average Convergence Divergence, MACD.
Once again, the website does not guarantee any results or investment return based on the information and instruction you have read here. It should be used as learning aids only and if you decide to trade real money, all trading decision should be your own.