October 21, 2017
^HSI Hong Kong Hang Seng Index and MACD Divergence
Picture worth a thousand words, see chart and predict what is next week movement.
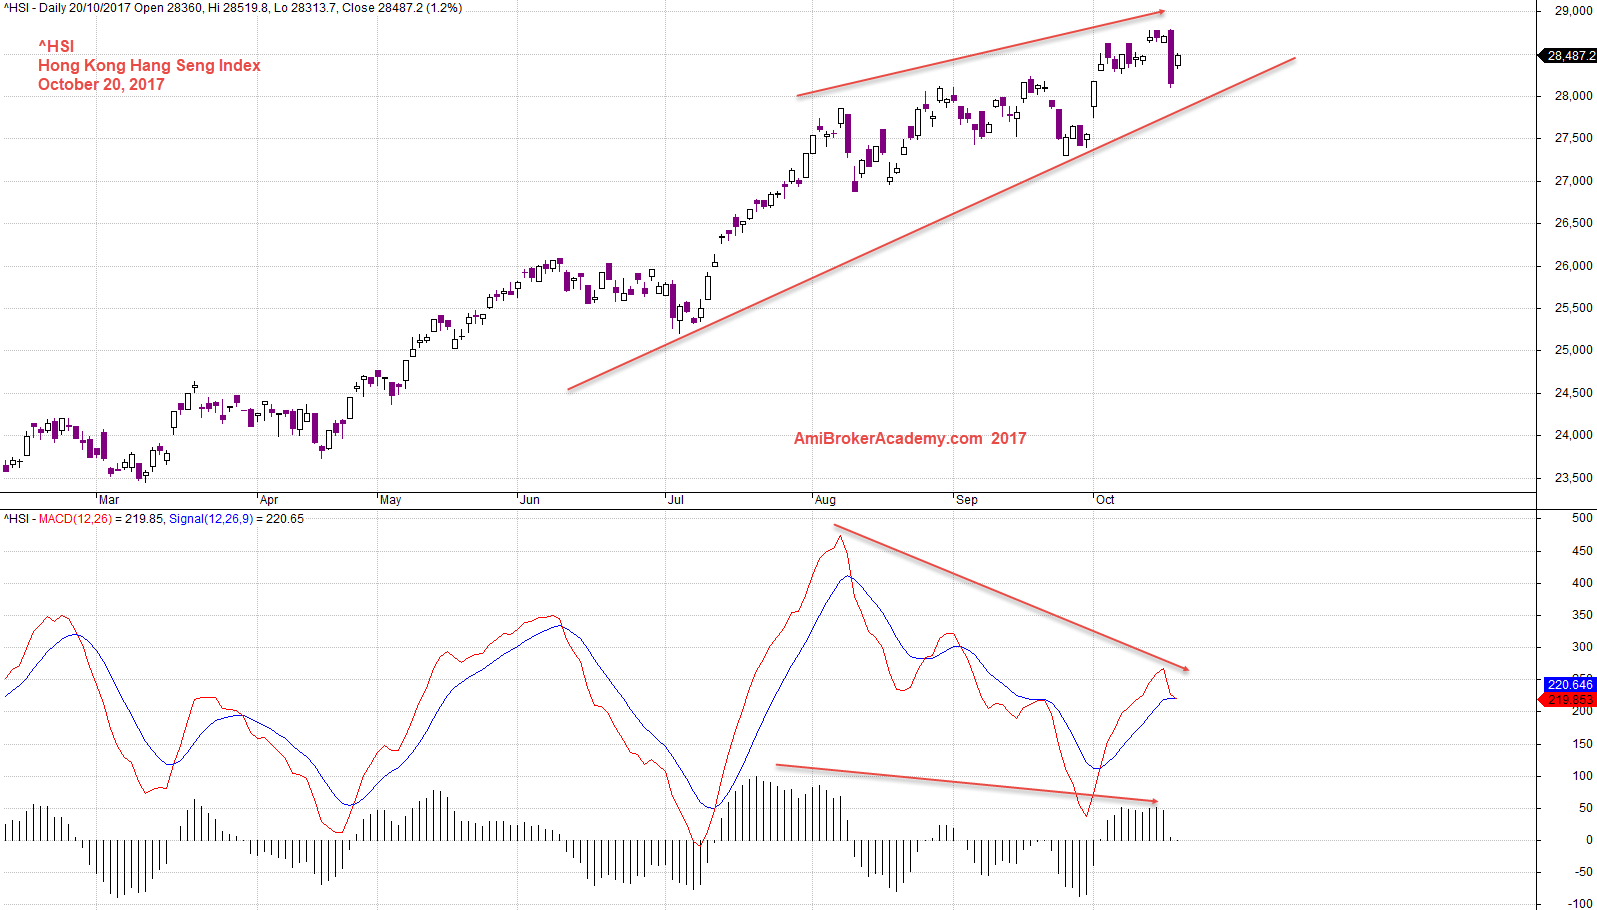
October 20, 2017 Hang Seng Index and MACD Divergence
October 20, 2017 Hong Kong Hang Seng Index and Key Levels
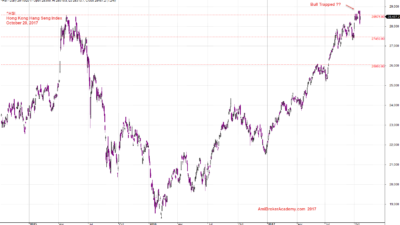
^HSI Hong Kong Hang Seng Index and Bull Trapped
See chart for more. If you can not see the entire chart, adjust your browser.
Read our posting on this analysis, Hang Seng Index Charting.
Next Week An Important Week for Hang Seng Index | AmiBrokerAcademy.com
Seba Smith | More Ways to Analysis | Hang Seng Index | AmiBrokerAcademy.com
Moses
AmiBrokerAcademy.com
Read:
Disclaimer
The above result is for illustration purpose. It is not meant to be used for buy or sell decision. We do not recommend any particular stocks. If particular stocks of such are mentioned, they are meant as demonstration of Amibroker as a powerful charting software and MACD. Amibroker can program to scan the stocks for buy and sell signals.
These are script generated signals. Not all scan results are shown here. The MACD signal should use with price action. Users must understand what MACD and price action are all about before using them. If necessary you should attend a course to learn more on Technical Analysis (TA) and Moving Average Convergence Divergence, MACD.
Once again, the website does not guarantee any results or investment return based on the information and instruction you have read here. It should be used as learning aids only and if you decide to trade real money, all trading decision should be your own.