1 October 2016
Moving Average Rock
When price action below MA, price is bearish. When price action above MA, price is bullish.
MA is a great visual tool in charting. When fast ma ie 20 MA is below slow ma ie 50 MA, it is bearish. On the other hand, when 20 Ma is above 50 MA, it is bullish.
Picture worth a thousand words, ^HSI is above the MAs, the index is bullish. However, the last weeks, the index could not close above the high. Still bullish? Even it is bull, it is a weak bull. ^HSI is facing a pullback. Trade with care, manage your risk.
^HSI Hong Kong Hang Seng Index Charting and MACD
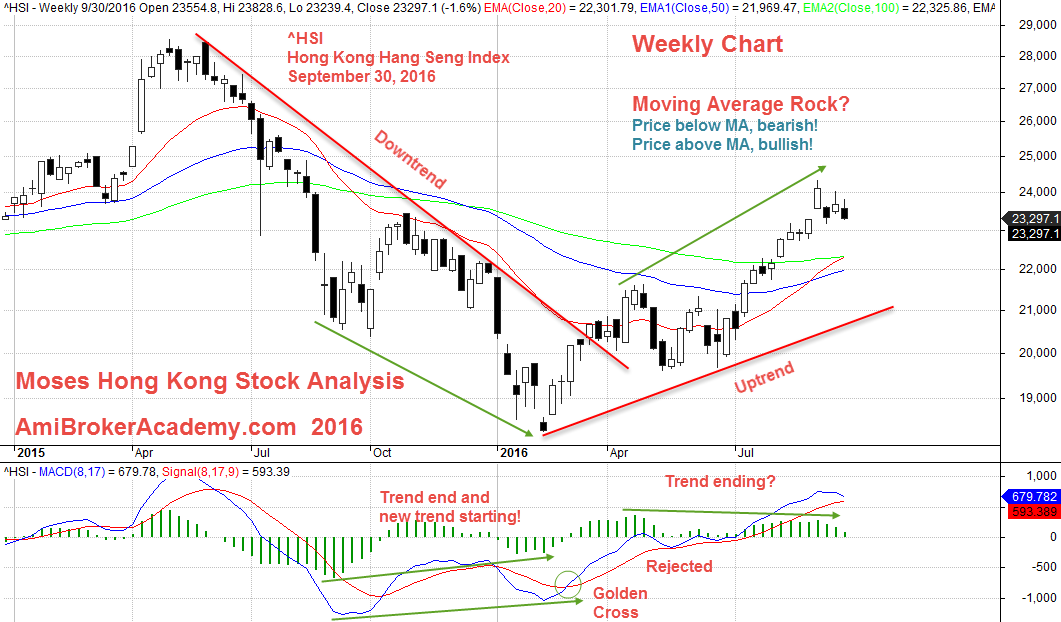
September 30, 2016 Hong Kong Hang Seng Index Weekly and MACD
HSI Closeup View
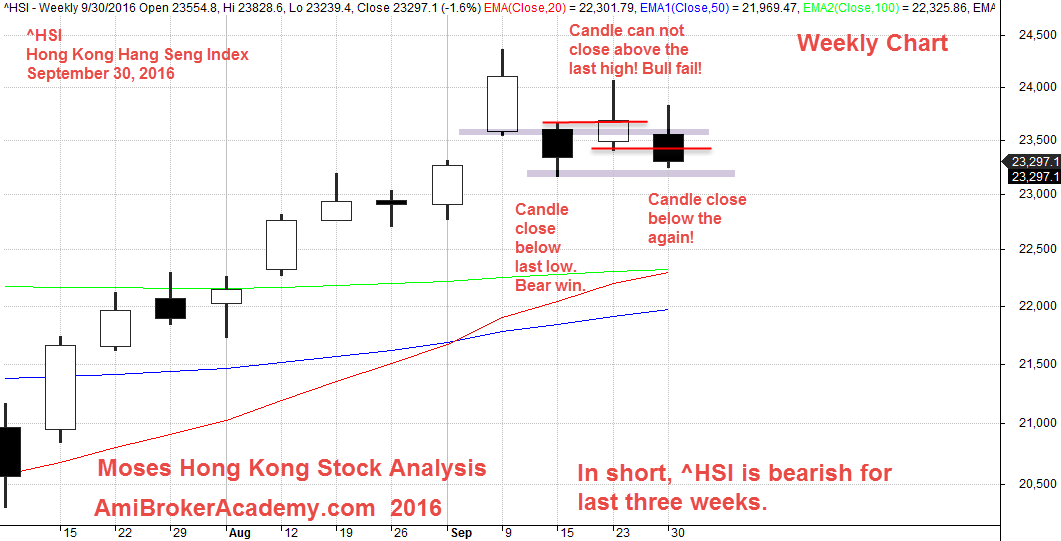
September 30, 2016 Hong Kong Hang Seng Closeup View
Have fun!
Moses Hong Kong Stock Analysis
AmiBrokerAcademy.com
Disclaimer: All information, data and material contained, presented, or provided on amibrokeracademy.com is for educational purposes only. It is not to be construed or intended as providing trading or legal advice. Decisions you make about your trading or investment are important to you and your family, therefore should be made in consultation with a competent financial advisor or professional. We are not financial advisor and do not claim to be. Any views expressed here-in are not necessarily those held by amibrokeracademy.com. You are responsible for your trade decision and wealth being.