September 19, 2016
OUE Limited Quick Analysis
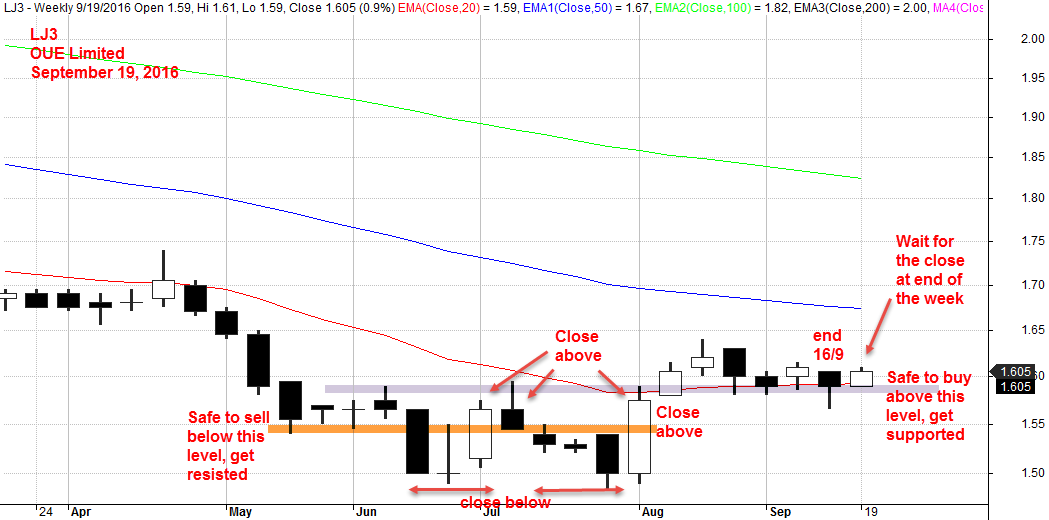
If the bar does not close below the level we drew here, the trend continue to stay bullish. The week started right, the price action open and stay above the level. Wow!
Look, if we buy any where above the level and market stay bullish. We are right. Unfortunately, if the price action fall below the level. anywhere below the level means the bullishness is disappearing. We have to get out immediately.
Septemebr 19, 2016 OUE Limited Weekly Chart
OUE Limited Trend Analysis
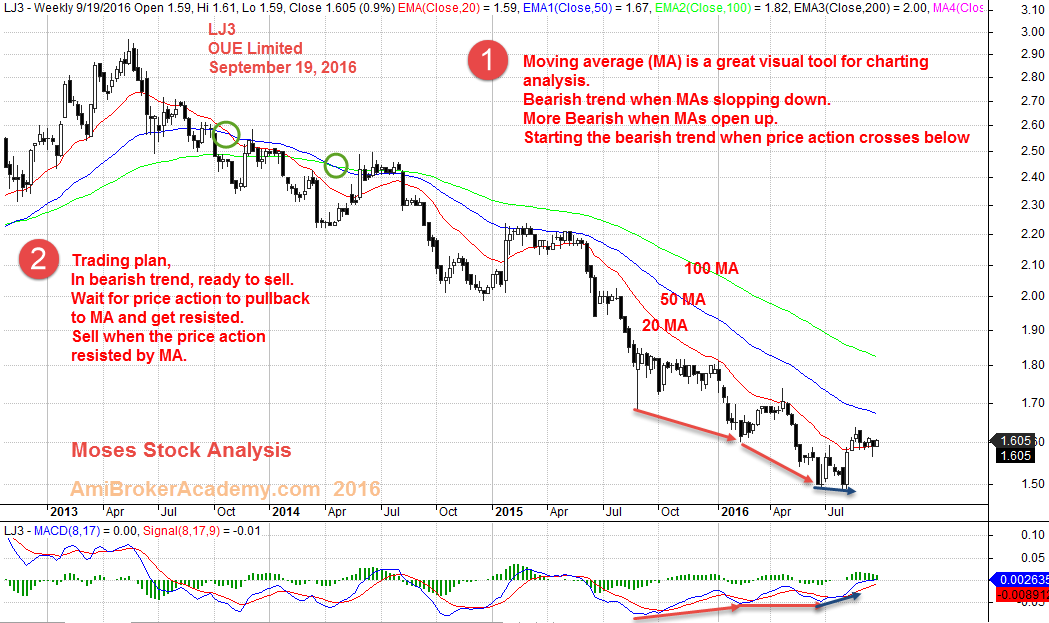
Moving average is a great visual tool for chart analysis. Bearish trend when fast ma is below slow ma.
When the price action cross up MA and stay above MA. It begins to become bullish. OUE is forming the base. Will see.
September 19, 2016 OUE Limited Weekly Chart
Long term is bearish, and short term is bullish. Trade bullish is consider counter trend. So be aware!
Moses Singapore Stock Analysis
AmiBrokerAcademy.com
Disclaimer: All information, data and material contained, presented, or provided on amibrokeracademy.com is for educational purposes only. It is not to be construed or intended as providing trading or legal advice. Decisions you make about your trading or investment are important to you and your family, therefore should be made in consultation with a competent financial advisor or professional. We are not financial advisor and do not claim to be. Any views expressed here-in are not necessarily those held by amibrokeracademy.com. You are responsible for your trade decision and wealth being.