September 3, 2017
This week, we google some of the stock code we commonly study. We are amaze of what we have done so far. If you have been with us, hope you have find something useful here. Enjoy learning. …
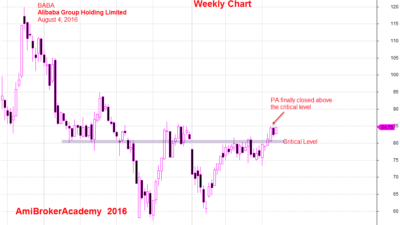
August 4, 2016 Alibaba Group Holding Weekly Chart
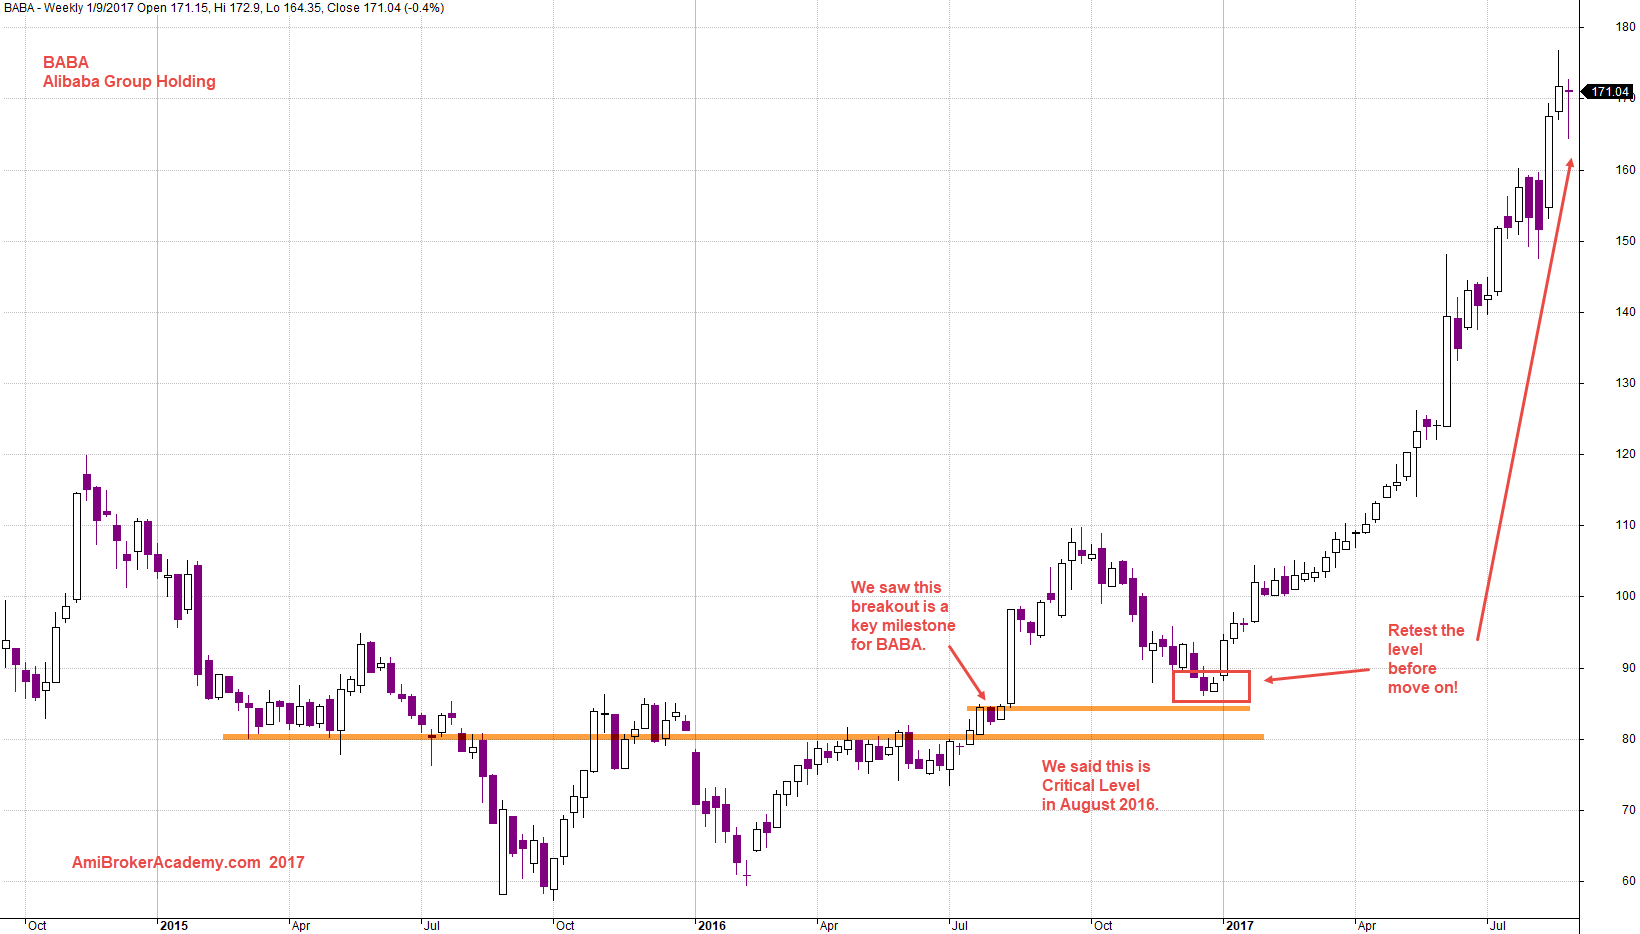
Do you remember you read this post before?
Google (search) to see some of the past baba posting. Realize that many of our analysis is ready mean something. We do not mean we are accurate in trend direction or the price movement, we mean we want the reader to pay attention to the chart, to what we have to say on what we see.
We trust many probably missed these posting. Many will probably looking for buy sell keyword. You would not learn anything if you just look out for buy sell key word.
Many of the analysis, when now look back. We just wonder how we dare to make such comment.
The method we use to read the chart, are using what we learn from our teacher on the technical analysis. Have fun!
Remember, there is no holy grail (the cup or platter used by Christ at the Last Supper) in trading. Sorry, I should not say no. It is very hard to find such as time has past. In trading, we have to agree the price action move in zigzag, the price just move according to the traders believe, good stocks, bad stocks.
Look Back!
See the following past posting for illustration.
Lesson: Critical Level and Price Action – BABA Alibaba Group Holding
Picture worth a thousand words. See chart for more. The chart below is a weekly chart.
Alibaba Group Holding and Critical Level
Moses
AmiBrokerAcademy.com
Disclaimer
The above result is for illustration purpose. It is not meant to be used for buy or sell decision. We do not recommend any particular stocks. If particular stocks of such are mentioned, they are meant as demonstration of Amibroker as a powerful charting software and MACD. Amibroker can program to scan the stocks for buy and sell signals.
These are script generated signals. Not all scan results are shown here. The MACD signal should use with price action. Users must understand what MACD and price action are all about before using them. If necessary you should attend a course to learn more on Technical Analysis (TA) and Moving Average Convergence Divergence, MACD.
Once again, the website does not guarantee any results or investment return based on the information and instruction you have read here. It should be used as learning aids only and if you decide to trade real money, all trading decision should be your own.