11 October 2016
How Much Time You can Save?
Imaging you have to scan through six thousands stocks to identify twenty potential stocks that might move in the next three to six months. How much you will need? One weeks, or three days. I think even you are given one month, you will properly can only scan through half of them.
But with a computer program, and tools such as MACD AFL Script, and AmiBrorker, this task will take you only less than ten minutes. And if you change your mind, instead of scan for stock hunder (100) dollars of more, you want the find stock in the rang of 10 to 65 dollars. Just update the selection parameter in a minutes and rerun the script. Yes, another may be ten minutes. How much time you can save in focus on other areas of your stock and risk management.
Powerful Charting Software – AmiBroker
If you have been following the site, you will sure know our free US One-day Stock MACD Scan filter stock for price from 100 dollars on wards and the stocks must have at least 1,000,000 shares changed hands on the day.
The following you will find US stocks filter for price ranging from 10 to 65 dollars and still the same for stocks that has minimum 1,000,000 stocks traded on the day. See insert on the parameters.
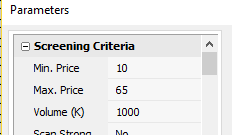
AmiBroker AFL Filer Parameters – select 10 to 65 dollars
The point here is when you using a powerful charting software like AmiBroker, you can just simply update the selection criteria such as price and volume, and it take less than 10 minutes to return the selection for your trading plan.
Remember we told you that in earlier posting title, Stock Trading is No Different From Running a Business , step number one is identify candidates, a stock or stocks before you focus in analysis. See another posting, Identify Potential Stocks.
What MACD Return Here
The script looks for MACD signals that has
- MACD line crosses above MACD signal – Bullish trend
- MACD line crosses above zero line – Bullish trend
- MACD Histogram +ve Divergence – Bullish trend
- MACD line crosses below MACD signal – Bearish trend
- MACD line crosses below zero line – Bearish trend
- MACD Histogram -ve Divergence – Bearish trend
MACD is a great indicator, it is simple and provides a leading signal on trend change.
Generally, trade on stocks that have MACD signals will provide a faster results as compare to those that do not have signal to begin with.
Note: all setup can fail. It is true for MACD setup too. Trade responsibly and manage your own risk.
The Following are Monday October 10, 2016 One-day US Stock MACD Screening Outcome
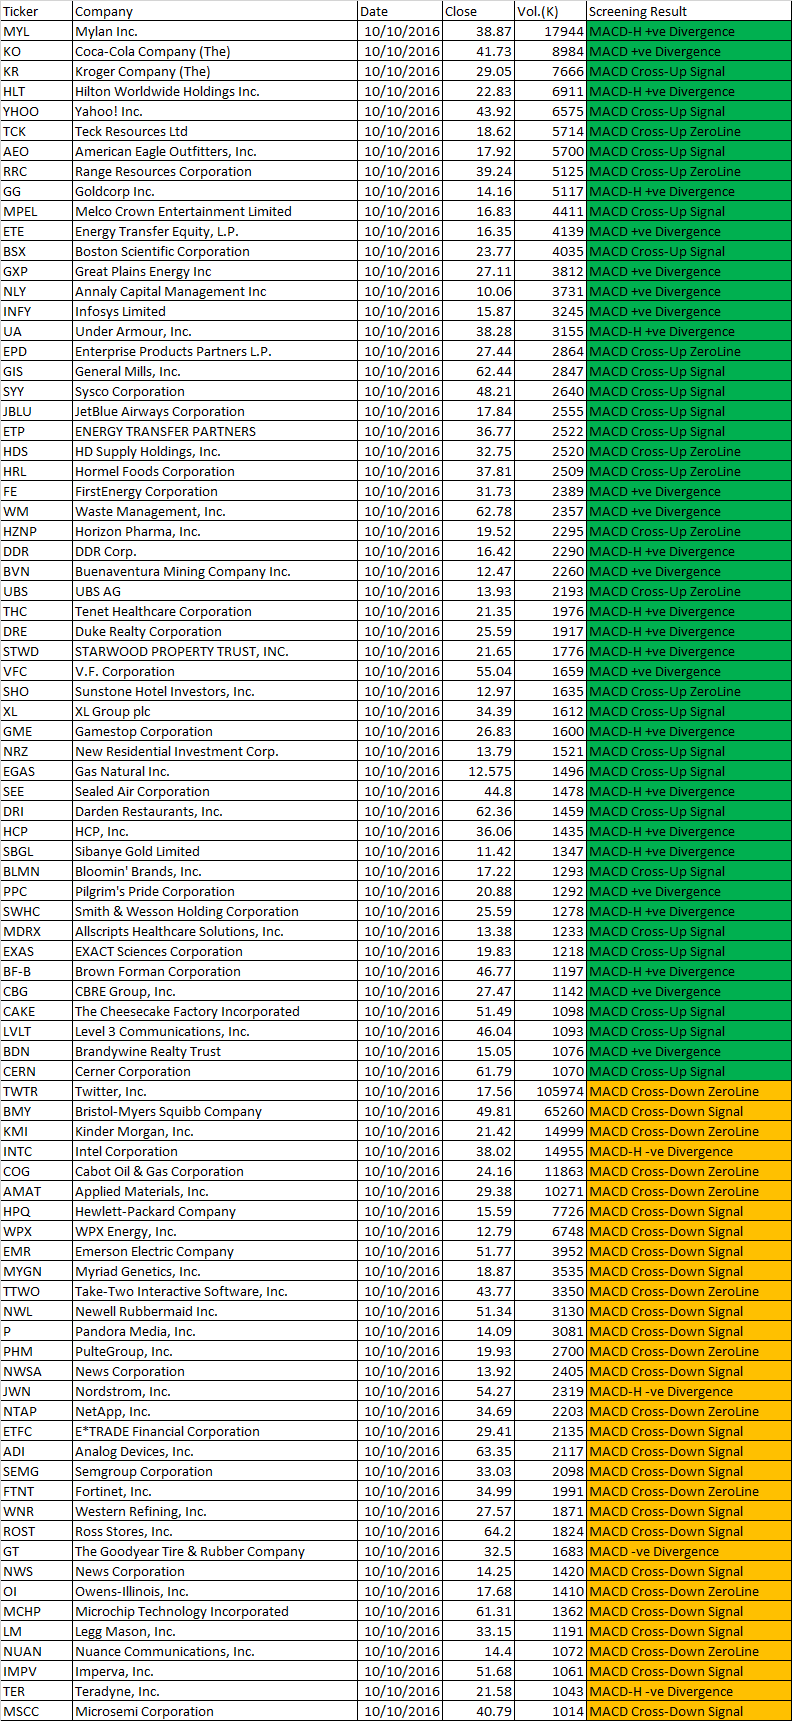
October 10, 2016 One Day US Stock MACD Scan Results between ten to sixty fivc Dollars
Mose US Stock Desk
AmiBrokerAcademy.com