April 19, 2017
5DP Heeton Holdings Charting and Channel
See chart moves up pullback and moves up again. Now the price stop at 0.49 dollars.
Do you know why the price stop here at 49 cents? See the next chart, 2016 to 2017. You see the 49 cents was the high of 2016 so it is a resistance that now turns support.
Most of the time you can measure the price move. There is always a reason why price stop at certain level.
Stock price was down since Great Recession
This stock has been suffering from the Great Recession in 2008, the stock price fall from the high of 97.5 cents to the low of 12.5 cents. What a great recession.
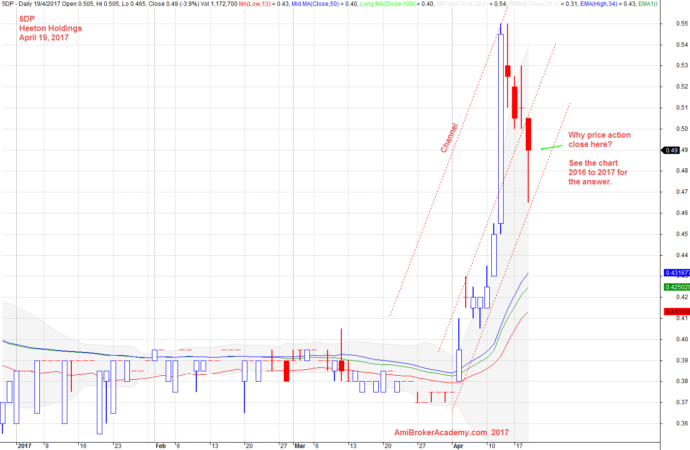
April 19, 2017 Heeton Holdings and Channels
5DP Heeton Holdings Charting and 2016 to 2017
Resistance turns support. That is why the price close at 49 cents.
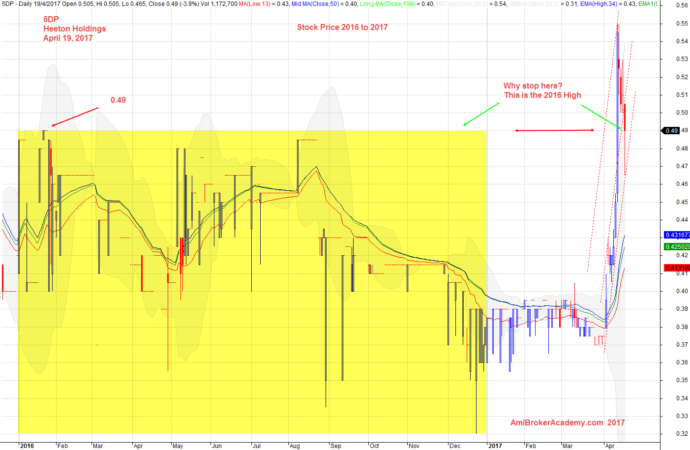
April 19, 2017 Heeton Holdings 2016 to 2017
5DP Heeton Holdings Charting and 2007 to 2017
The stock price is on a raising. After the Great Recession, the price ever bounced up to near 80 cents, in 2014. But the price fail to go higher. The price fail to near 20 cents, better than 12.5 cents in 2008.
Now the price stop at 49 cents, where will the price action goes next. Well the price has broken the 2016 high, can the price reach 2015 high? This is the question you may want to ask.
First the price action must breakout the 2014 low, the support before the price can retest the 2015 high.
Stock price was down since Great Recession
This stock has been suffering from the Great Recession in 2008, the stock price fall from the high of 97.5 cents to the low of 12.5 cents. What a great recession.
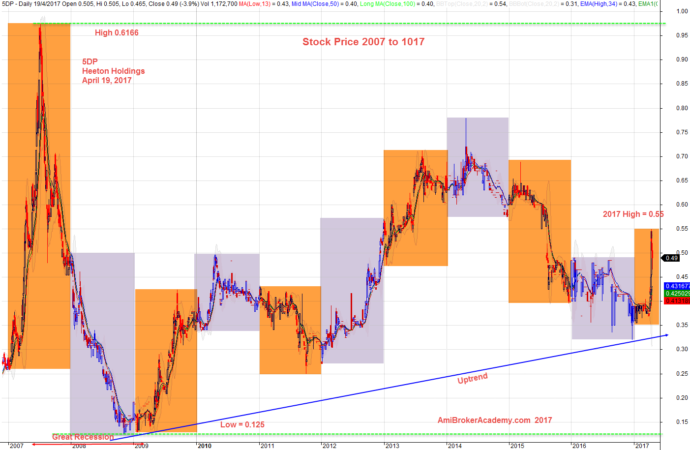
April 19, 2017 Heeton Holdings 2007 to 2017
Moses Stock Analysis
AmiBrokerAcademy.com
Disclaimer
The above result is for illustration purpose. It is not meant to be used for buy or sell decision. We do not recommend any particular stocks. If particular stocks of such are mentioned, they are meant as demonstration of Amibroker as a powerful charting software and MACD. Amibroker can program to scan the stocks for buy and sell signals.
These are script generated signals. Not all scan results are shown here. The MACD signal should use with price action. Users must understand what MACD and price action are all about before using them. If necessary you should attend a course to learn more on Technical Analysis (TA) and Moving Average Convergence Divergence, MACD.
Once again, the website does not guarantee any results or investment return based on the information and instruction you have read here. It should be used as learning aids only and if you decide to trade real money, all trading decision should be your own.