August 8, 2017
^DJI Dow Jones Industrial Average Index and Hang Seng Index Benchmark on the Same Chart
See chart for more, of course you could choose a period and just browse through all the indexes on your data base. See the example below.
Yahoo! Finance provides free download for the data. Kudos to the founder of Yahoo! Provides such a excellence community services for finance market.
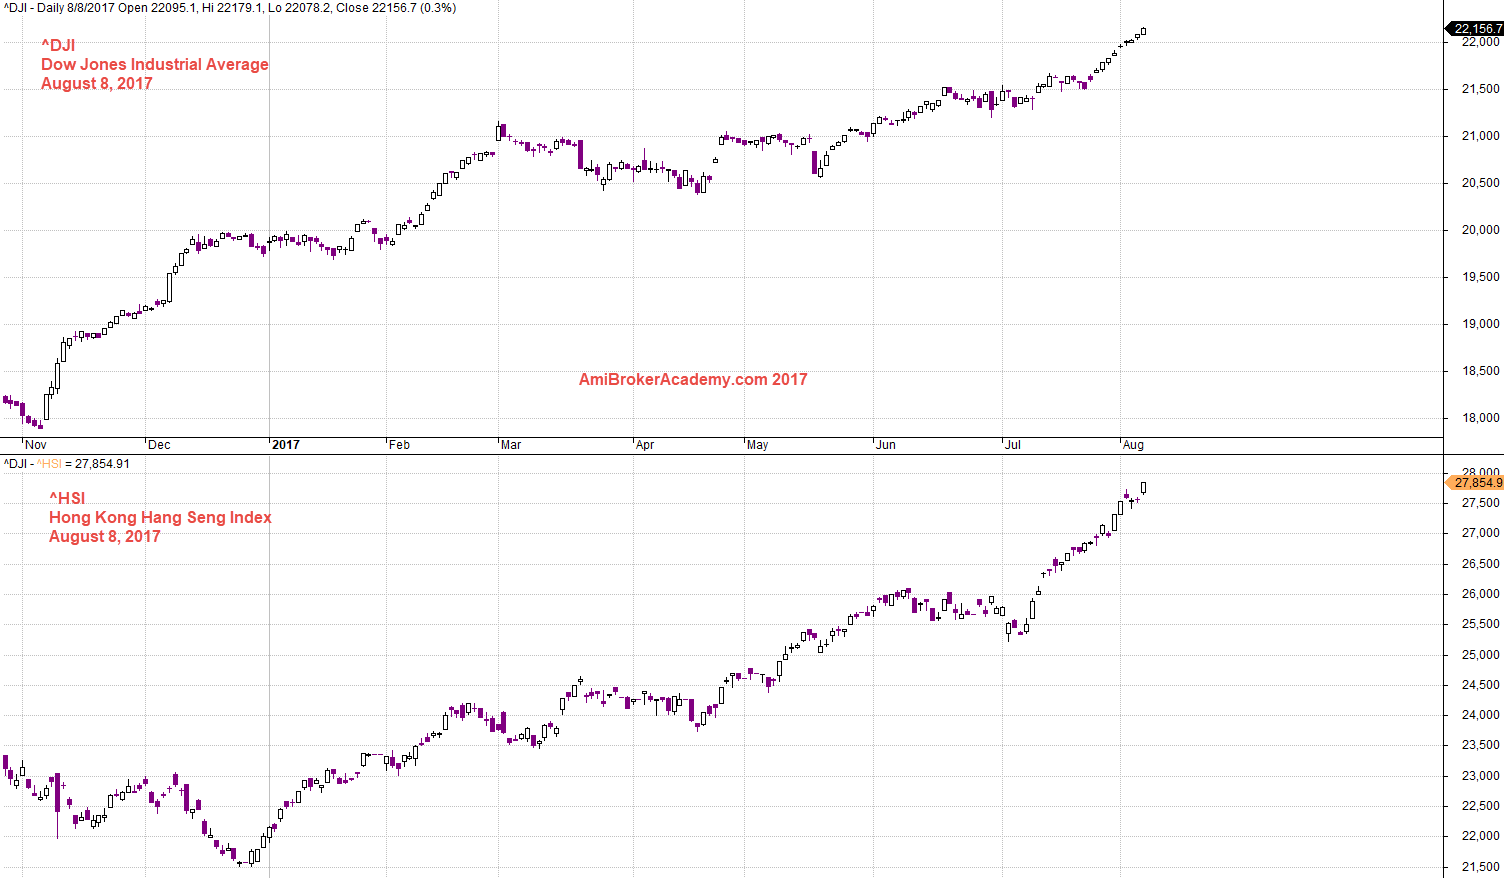
August 8, 2017 Dow Jones Industrial Average and Hang Seng Index
^DJI Dow Jones Industrial Average Index and MACD
See chart for more.
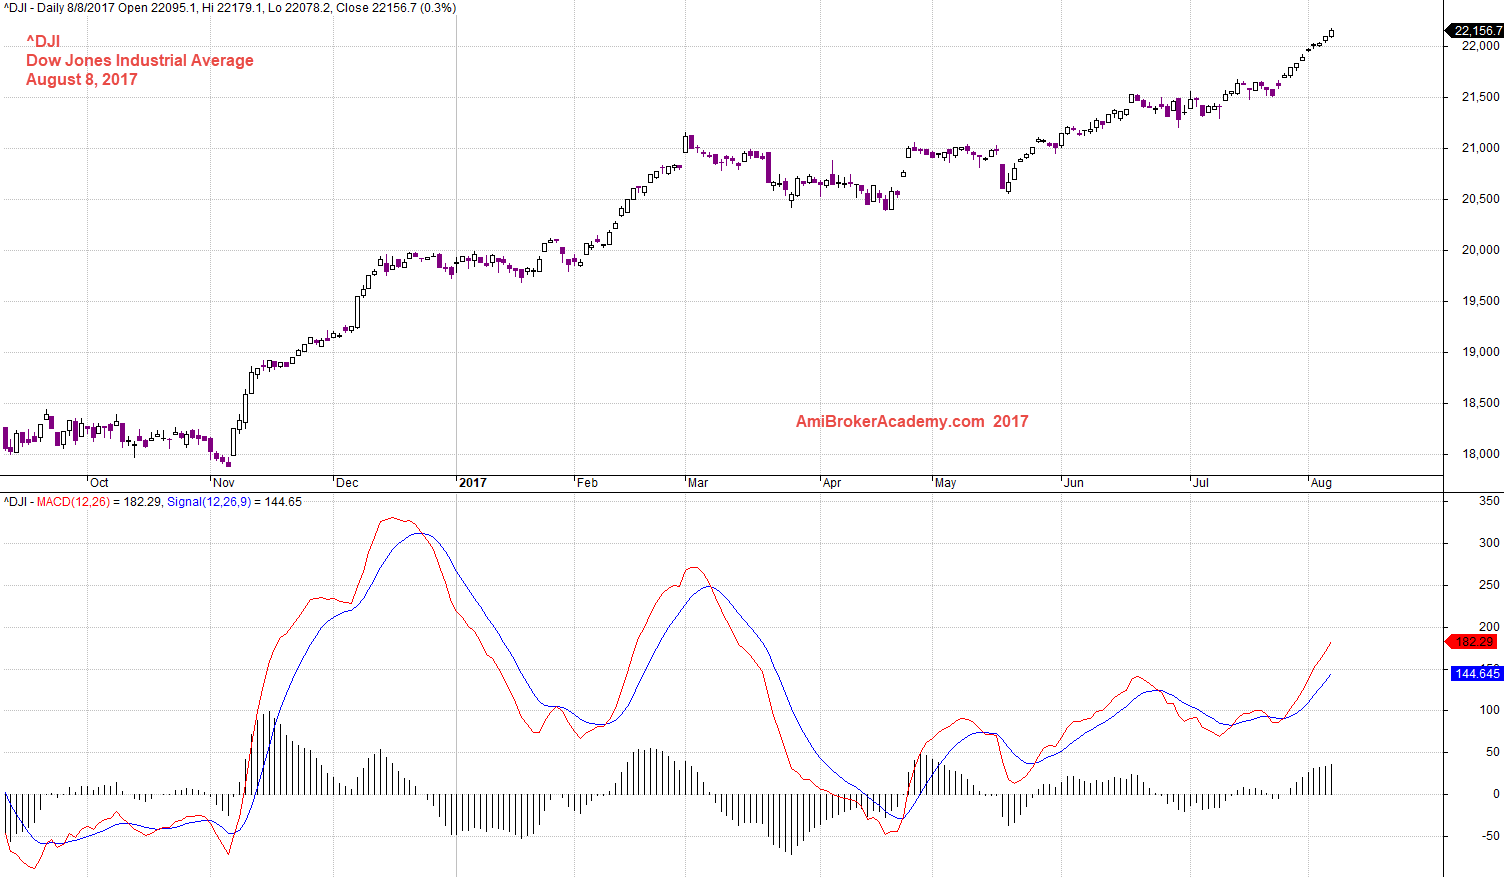
August 8, 2017 Dow Jones Industrial Average and MACD
^N225 Japan Index Nikkei 225 Index and MACD
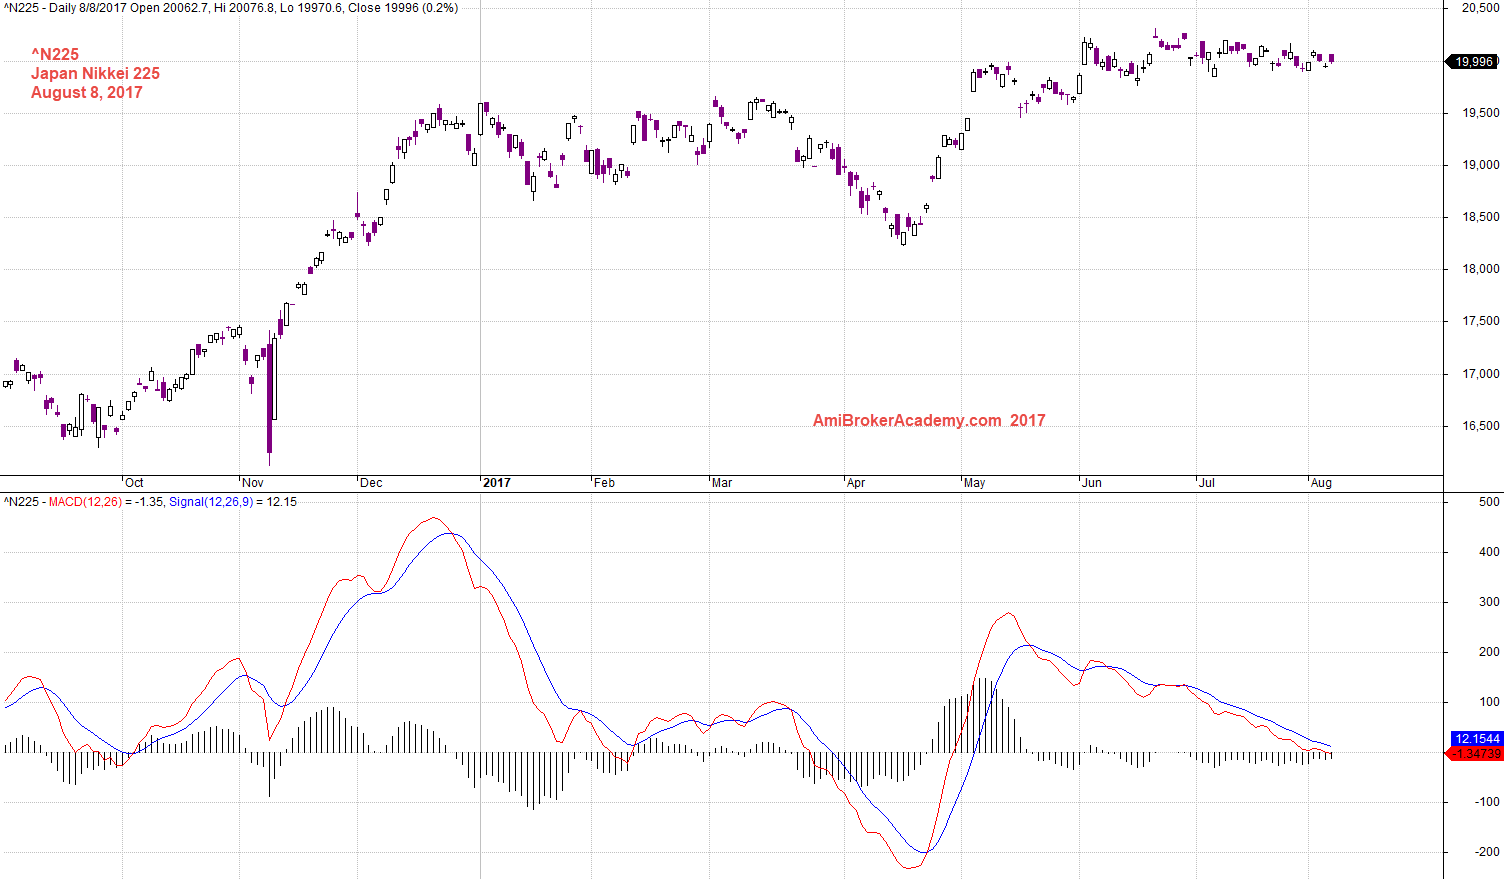
August 8, 2017 Japan Index Nikkei 225 Index and MACD
^SSEC China Shanghai SEC Index and MACD
See chart for more. Shanghai Stock Exchange Index.
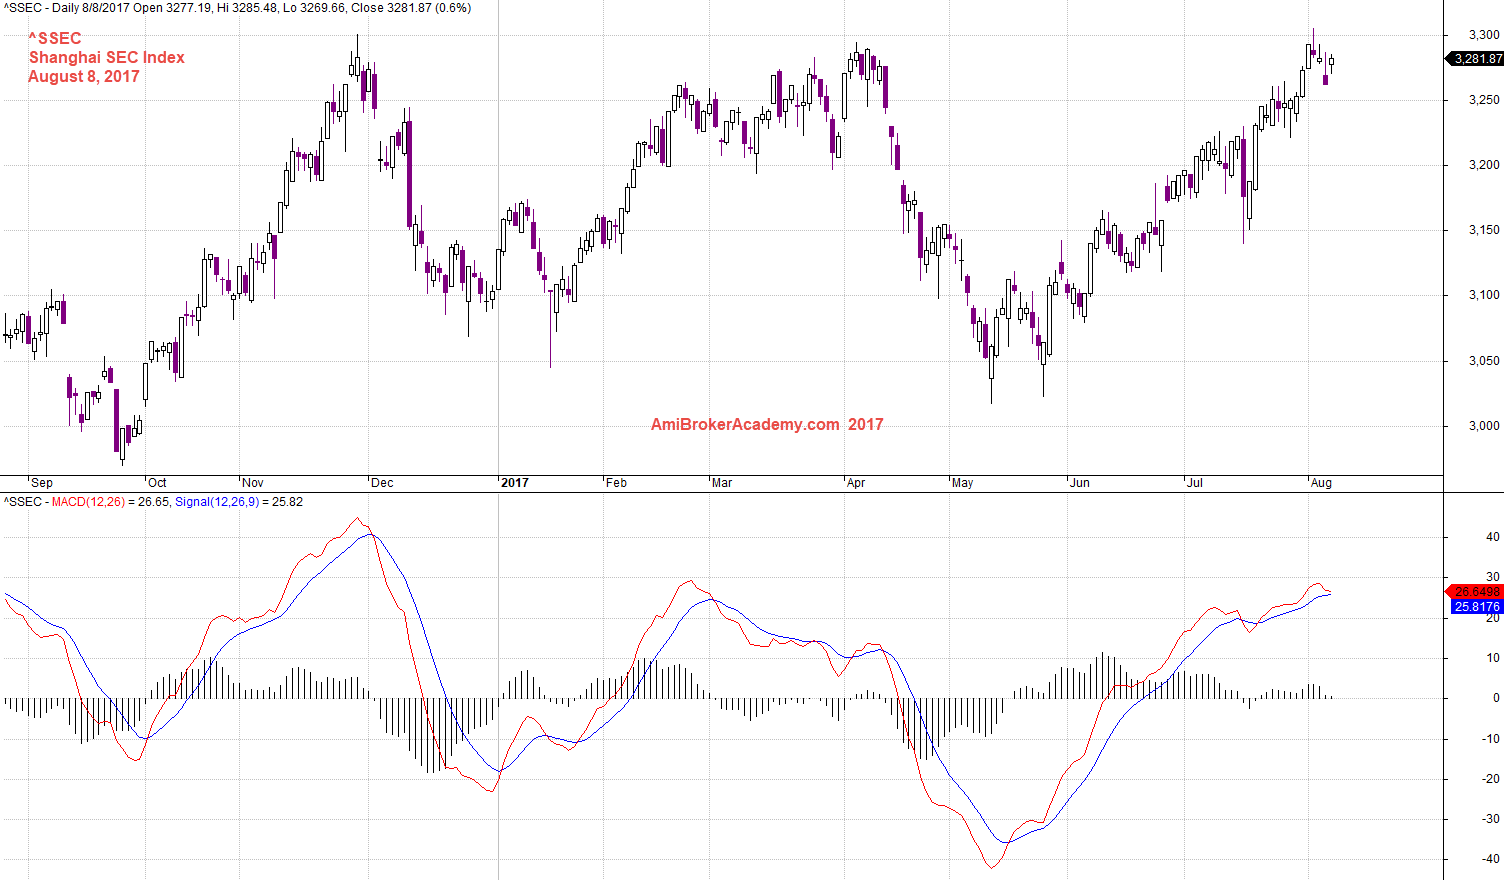
August 8, 2017 China Shanghai SEC Index and MACD
US ^IXIC NASDAQ Composite Index and MACD
See chart for more.
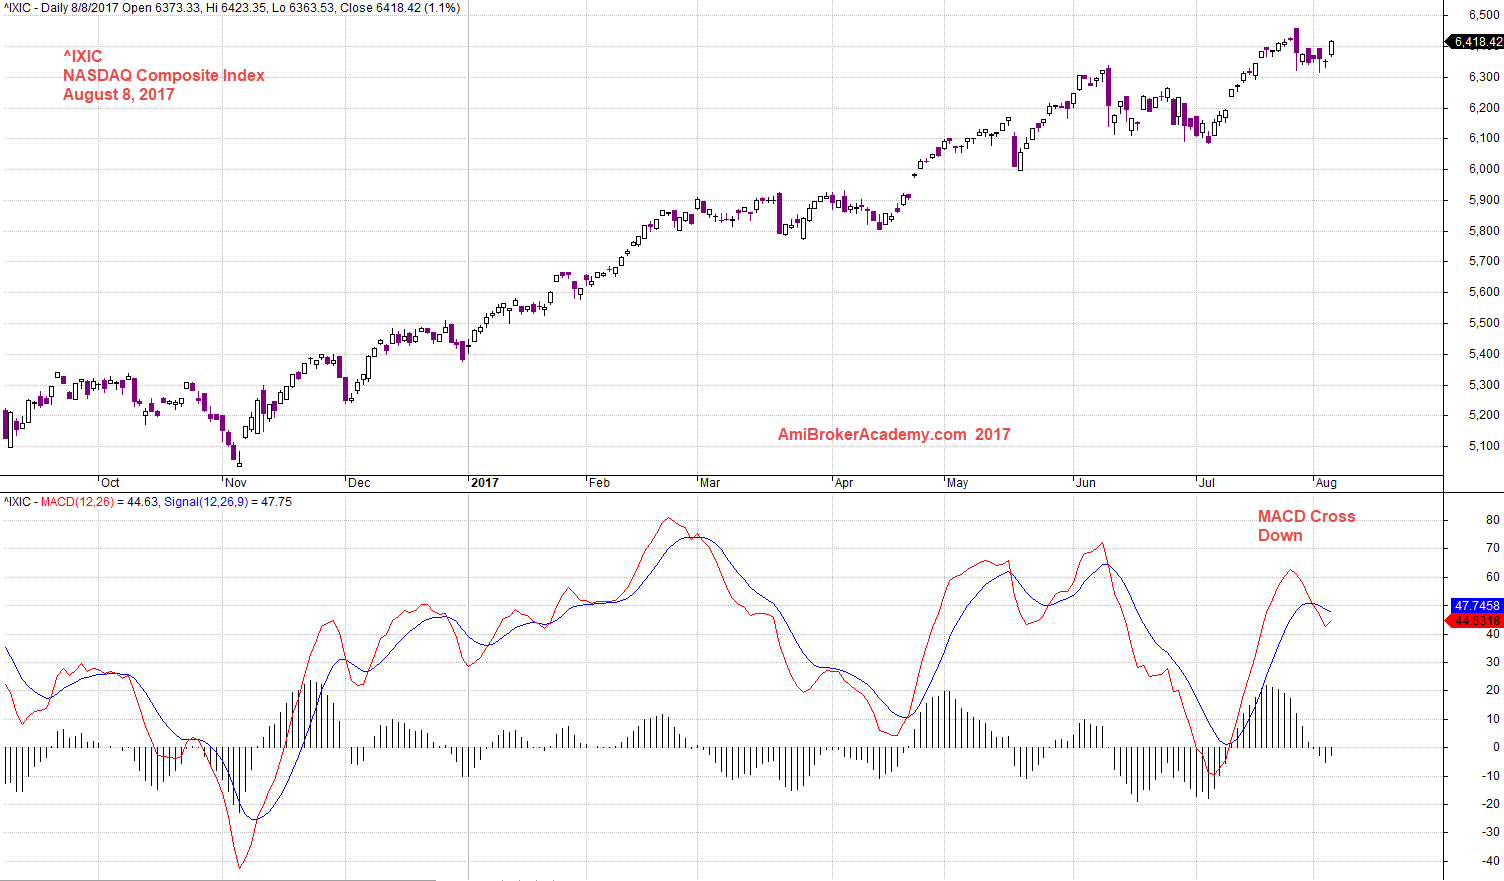
August 8, 2017 NASDAQ Composite Index and MACD
Singapore ST Index and MACD
The Straits Times Index, see chart for more.
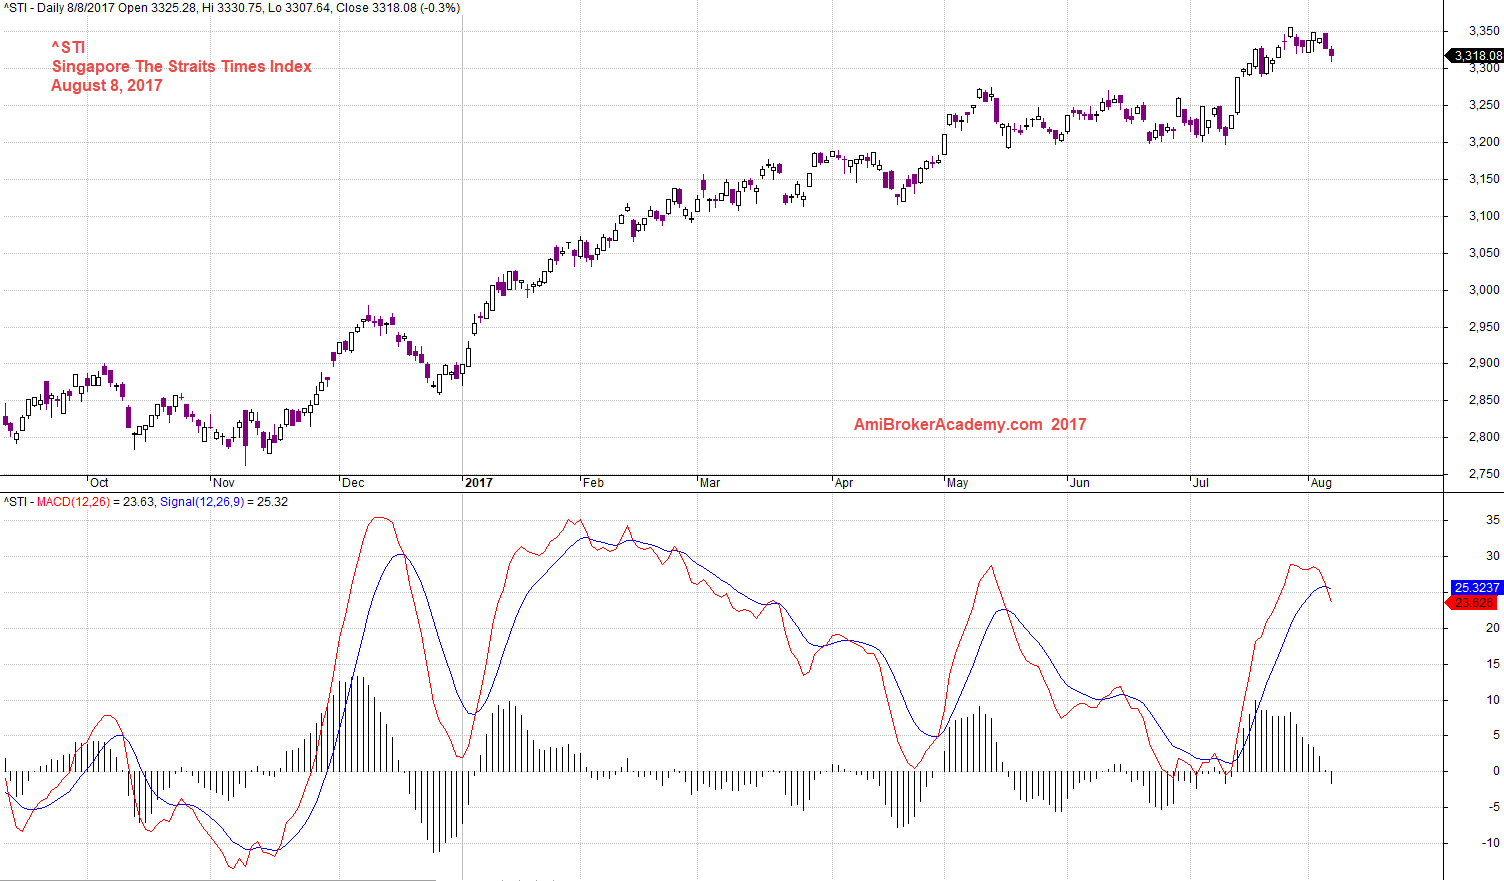
August 8, 2017 The Straits Times Index and MACD
^SSMI Swiss Market Index and MACD
See chart for more.
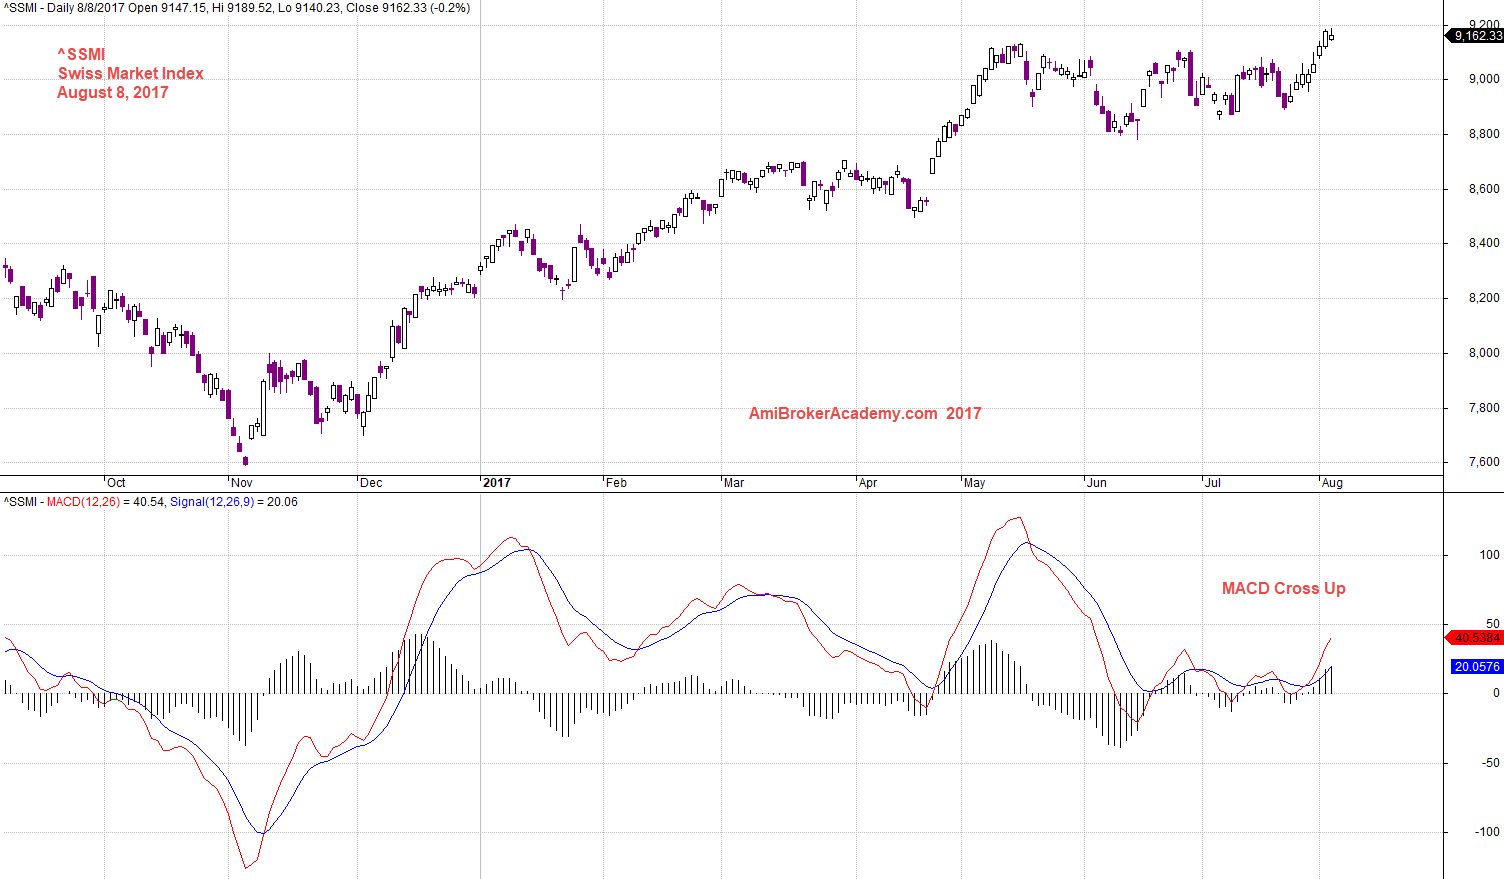
August 8, 2017 Swiss Market Index and MACD
^XAU PHLX Gold Silver Index and MACD
See chart for more.
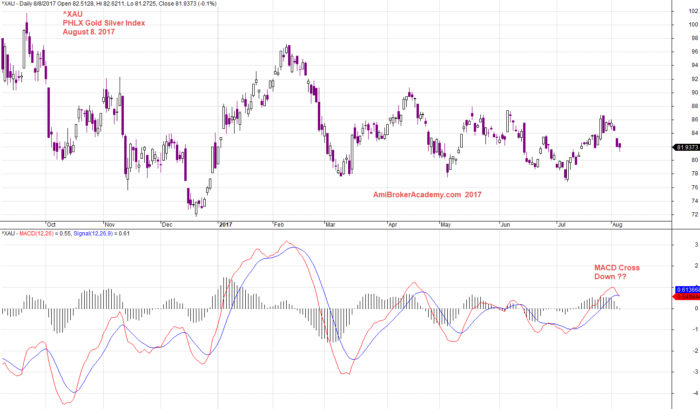
August 8, 2017 PHLX Gold Silver Index and MACD
^VIX Volatility Index and MACD
See chart for more, picture worth a thousand words.
What is the fear level? Low.
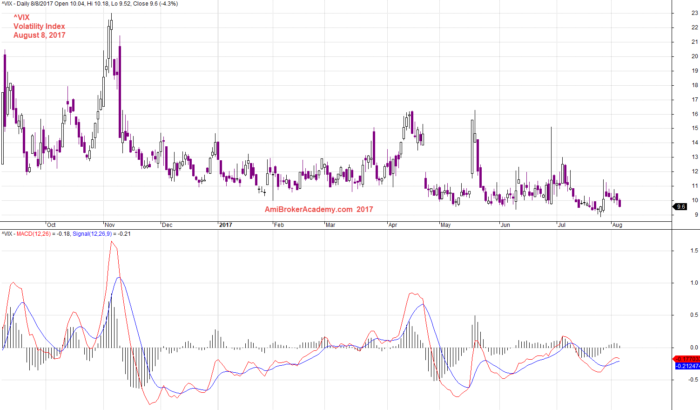
August 8, 2017 Volatility Index and MACD
S&P 500 Index ^GSPC and MACD
See chart for more, picture worth a thousand words.
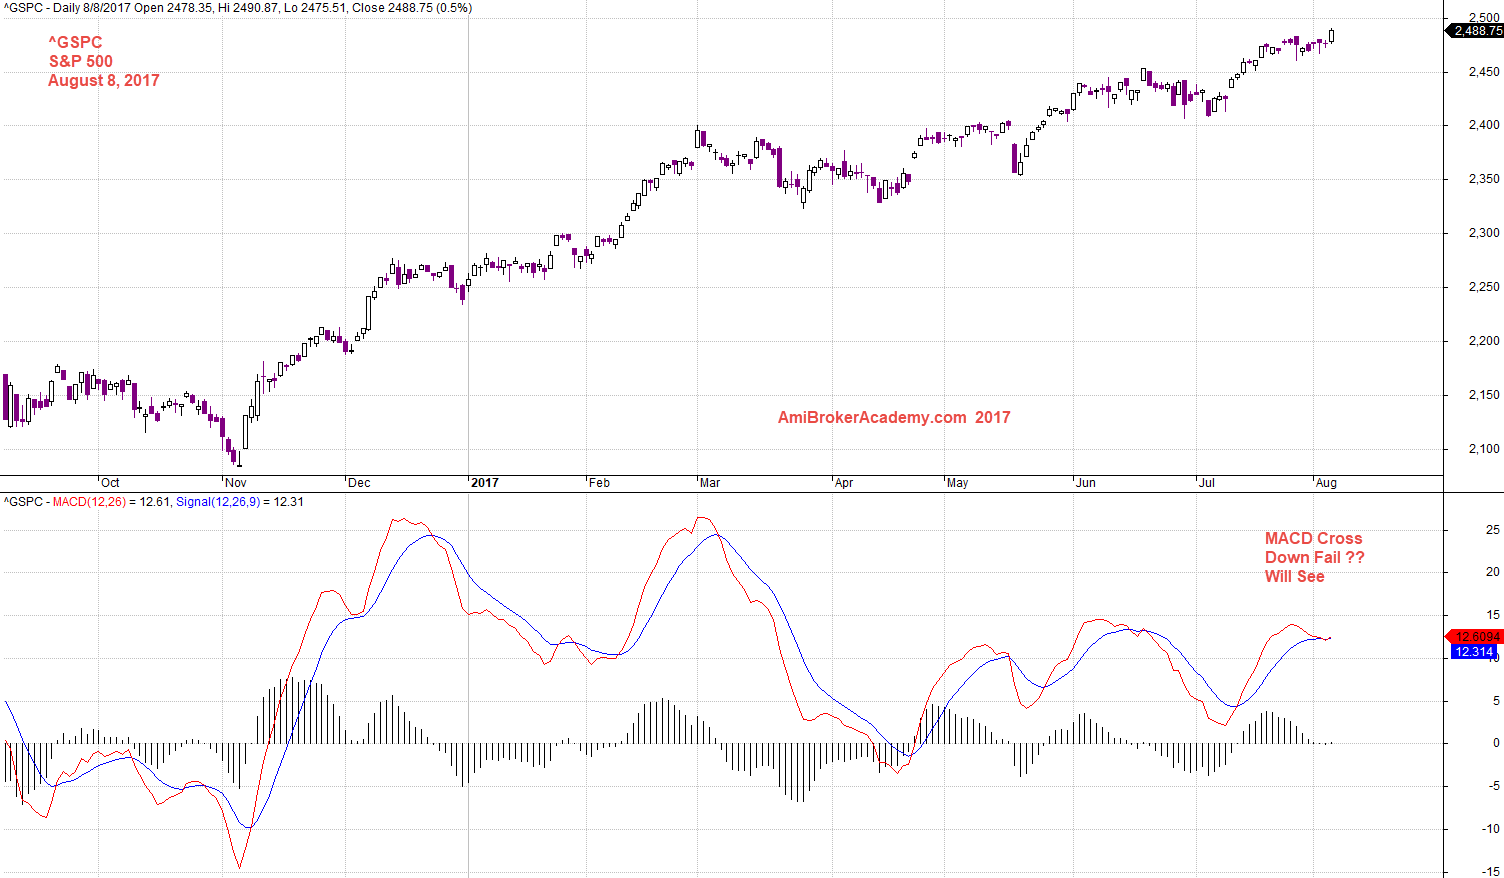
August 8, 2017 S&P 500 Index and MACD
NYSE Index and MACD
See chart for more, picture worth a thousand words.
See Fibonacci level too.
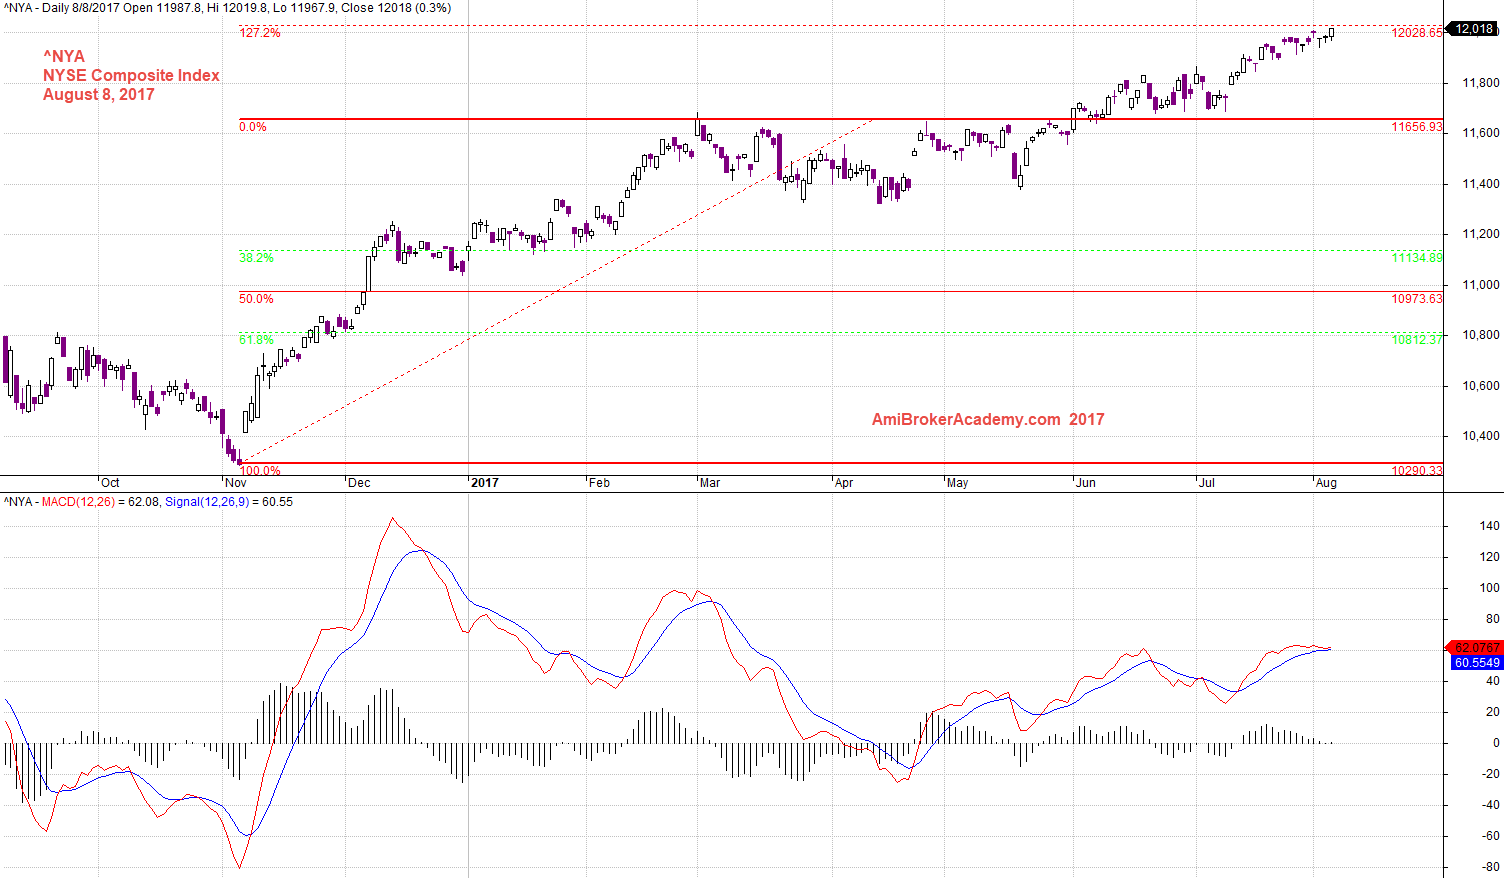
August 8, 2017 NYSE Composite Index and MACD
Hong Kong Hang Seng Index and MACD
See chart for more, picture worth a thousand words.
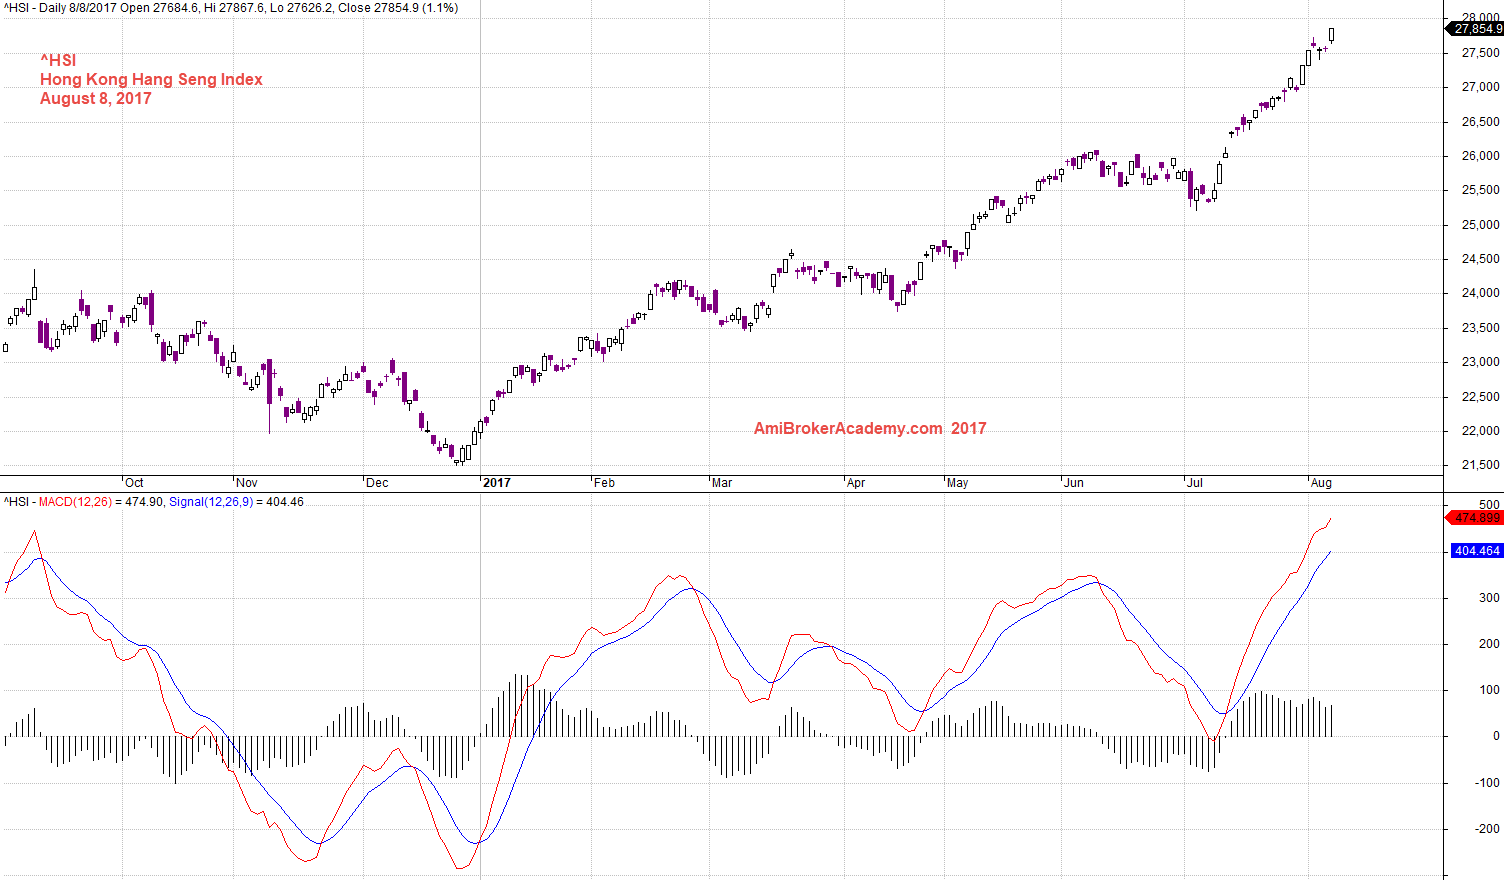
August 8, 2017 Hong Kong Hang Seng Index and MACD
Hong Kong Hang Seng Index and MACD
If you come this far, you will see another powerful feature of AmiBroker. See chart for more, picture worth a thousand words.
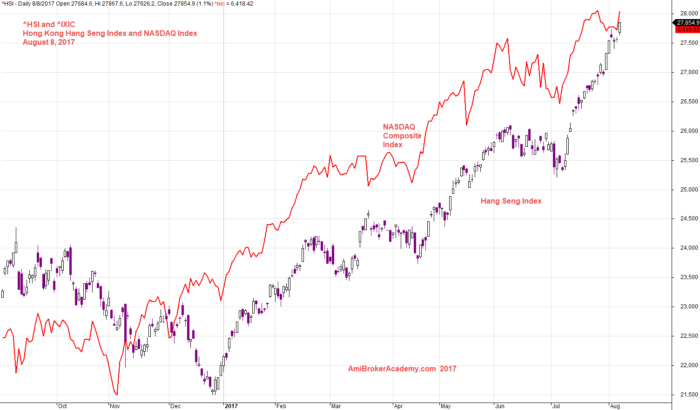
August 8, 2017 Hong Kong Hang Seng Index and US NASDAQ Composite Index
Thanks for visit the site here. You could also find free MACD scan here in this site too.
Moses
AmiBrokerAcademy.com
Disclaimer
The above result is for illustration purpose. It is not meant to be used for buy or sell decision. We do not recommend any particular stocks. If particular stocks of such are mentioned, they are meant as demonstration of Amibroker as a powerful charting software and MACD. Amibroker can program to scan the stocks for buy and sell signals.
These are script generated signals. Not all scan results are shown here. The MACD signal should use with price action. Users must understand what MACD and price action are all about before using them. If necessary you should attend a course to learn more on Technical Analysis (TA) and Moving Average Convergence Divergence, MACD.
Once again, the website does not guarantee any results or investment return based on the information and instruction you have read here. It should be used as learning aids only and if you decide to trade real money, all trading decision should be your own.