August 20, 2017
IT Fundamental
Information technology is the new name, used to call data processing, computers and the worst case personal computer. Of course, anything device come with a processor may be is computer. So your mobile phone that has the 4 cores, 8 cores processors probably more powerful than the computer in the early 70s.
But, the company still remain computer company besides the personal computer become computer like Apple is may be IBM.
Many of the companies have disappeared. Quite frequent there were the causes of the company themself. Even if the company still around, but they are no longer selling computer. Such as Digital, Data General, Compaq, Perkin Elmer, Wang, and so on. I just came out with these from my memory without verify again.
Let’s look at the only company I still can remember is computer company. Although the company may think something else. I remember someone told me the company is a service provider, a service company. In fact, many companies admire its move away from computer (may be today some call them server, future may be called pad, tabler).
Are You Thinking About Buying IBM Share?
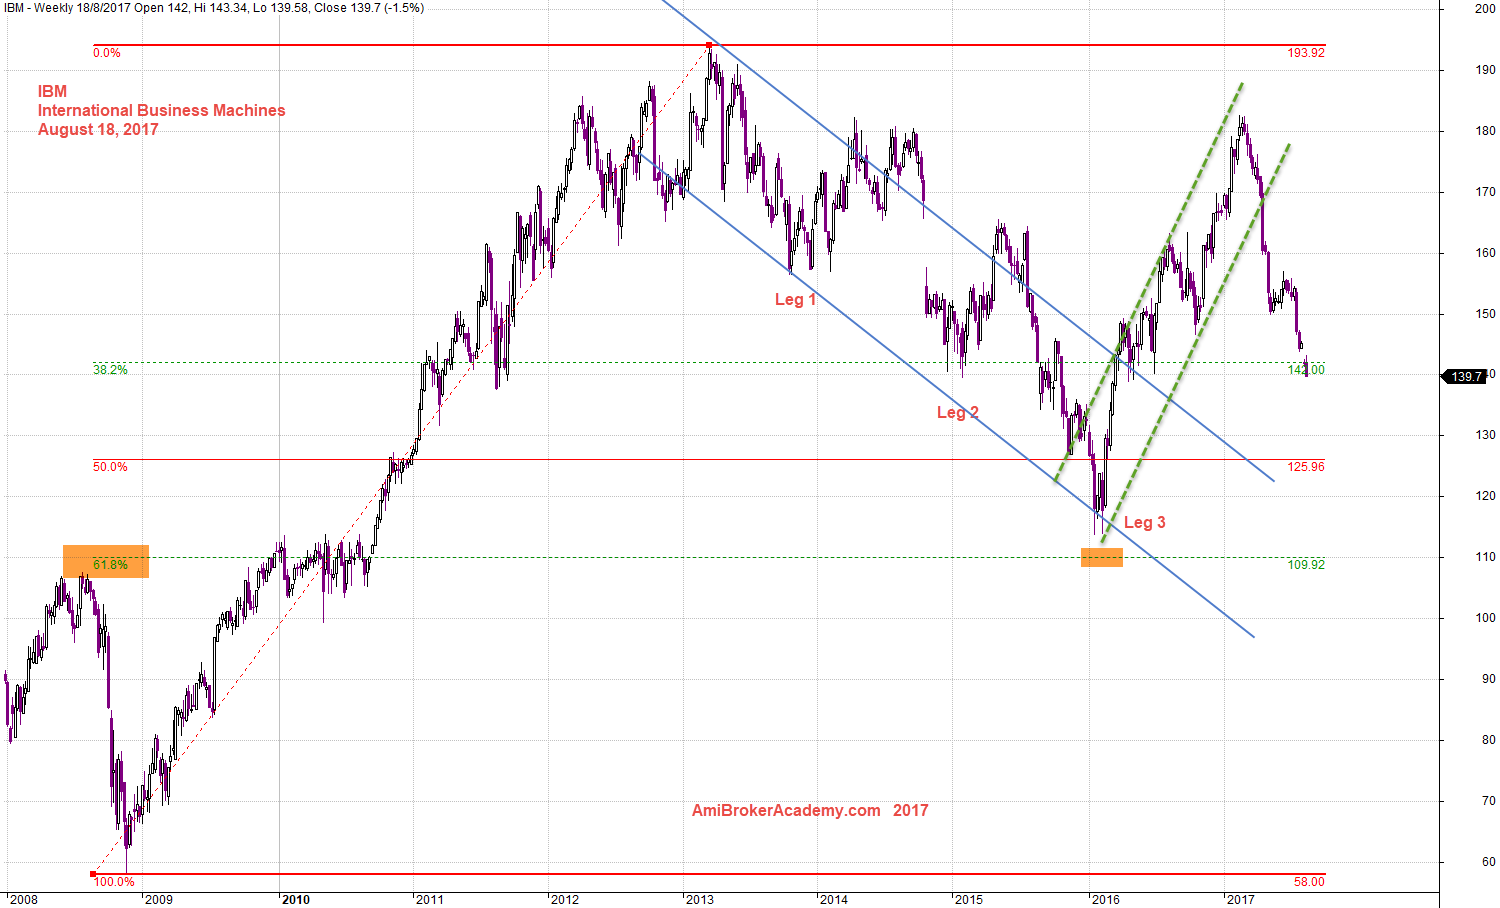
IBM International Business Machines and Fibonacci Extension
See chart for more, picture worth a thousand words.
Share price hit the peak $190 (just round up the number for easy discussion and memory), this is a very important level. Why? The share price can not breakout higher.
Then, the share price pullback down to $115.
Can $115 hold the fall? Sure, the picture shows the results.
Remember, professional buy retracement. If you did catch the price near $115. You are great. Now the price has pullback again. Now the price is near $140.
Let study the chart a bit more. See the charts that followed.
The following chart, show swing low to swing high and the support from the retracement.
August 18, 2017 IBM International Business Machines and Fibonacci Extensions
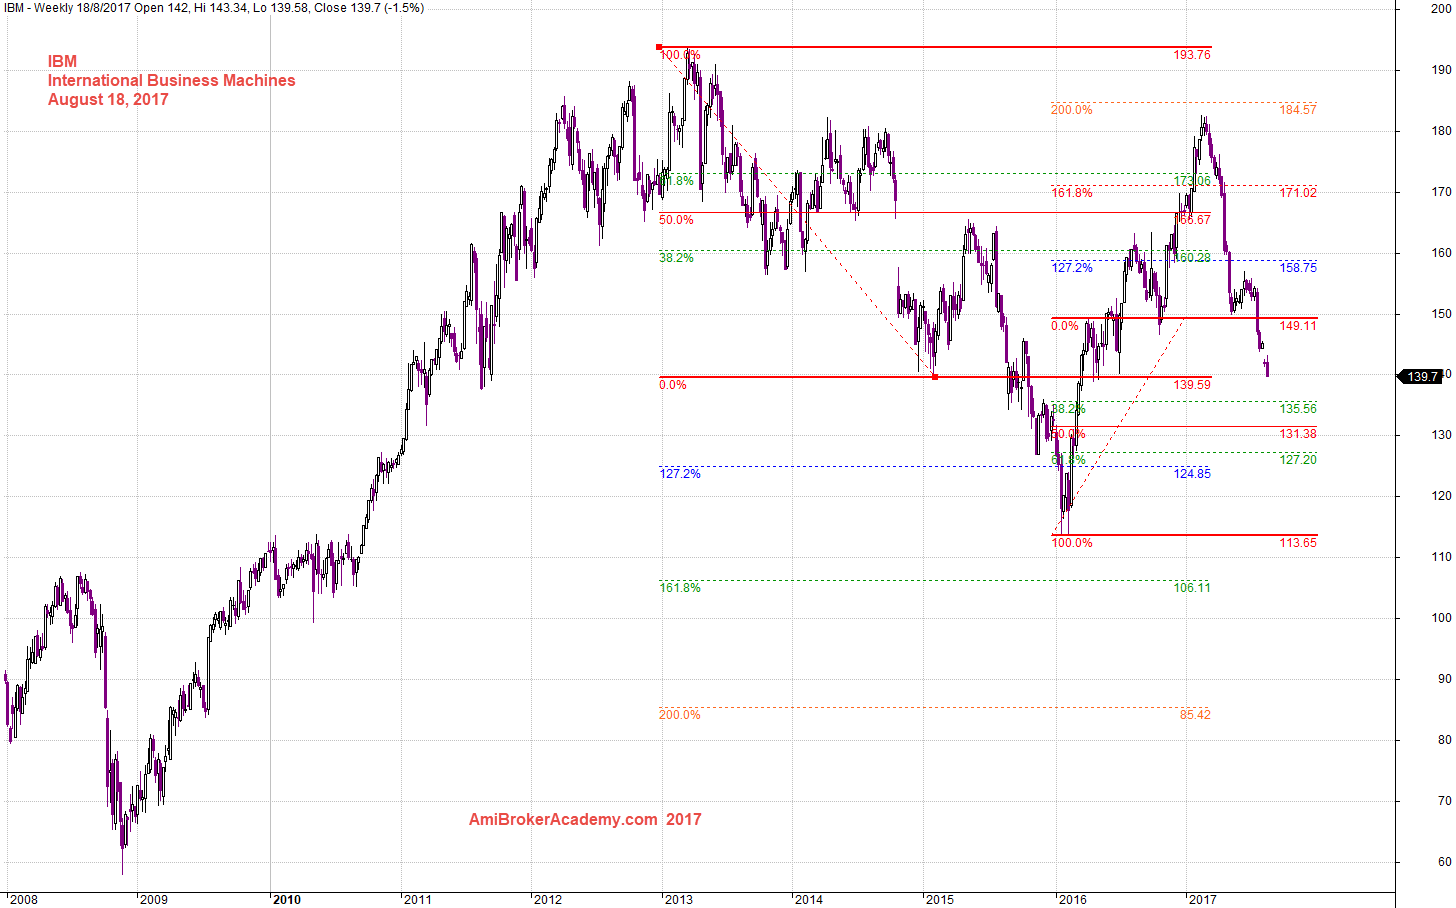
IBM Fibonacci For Swing High to Swing Low Followed BY Swing Low to Swing High
Picture worth a thousand words. See chart for more. The share price was near 61 % on the last Fibonacci on the above chart.
The following is showing swing high to swing low, followed by swing low to swing high.
August 18, 2017 International Business Machines and Fibonacci
IBM and Gartley ABCD Chart Pattern
Picture worth a thousand words, see an ABCD sell pattern. Watch out.
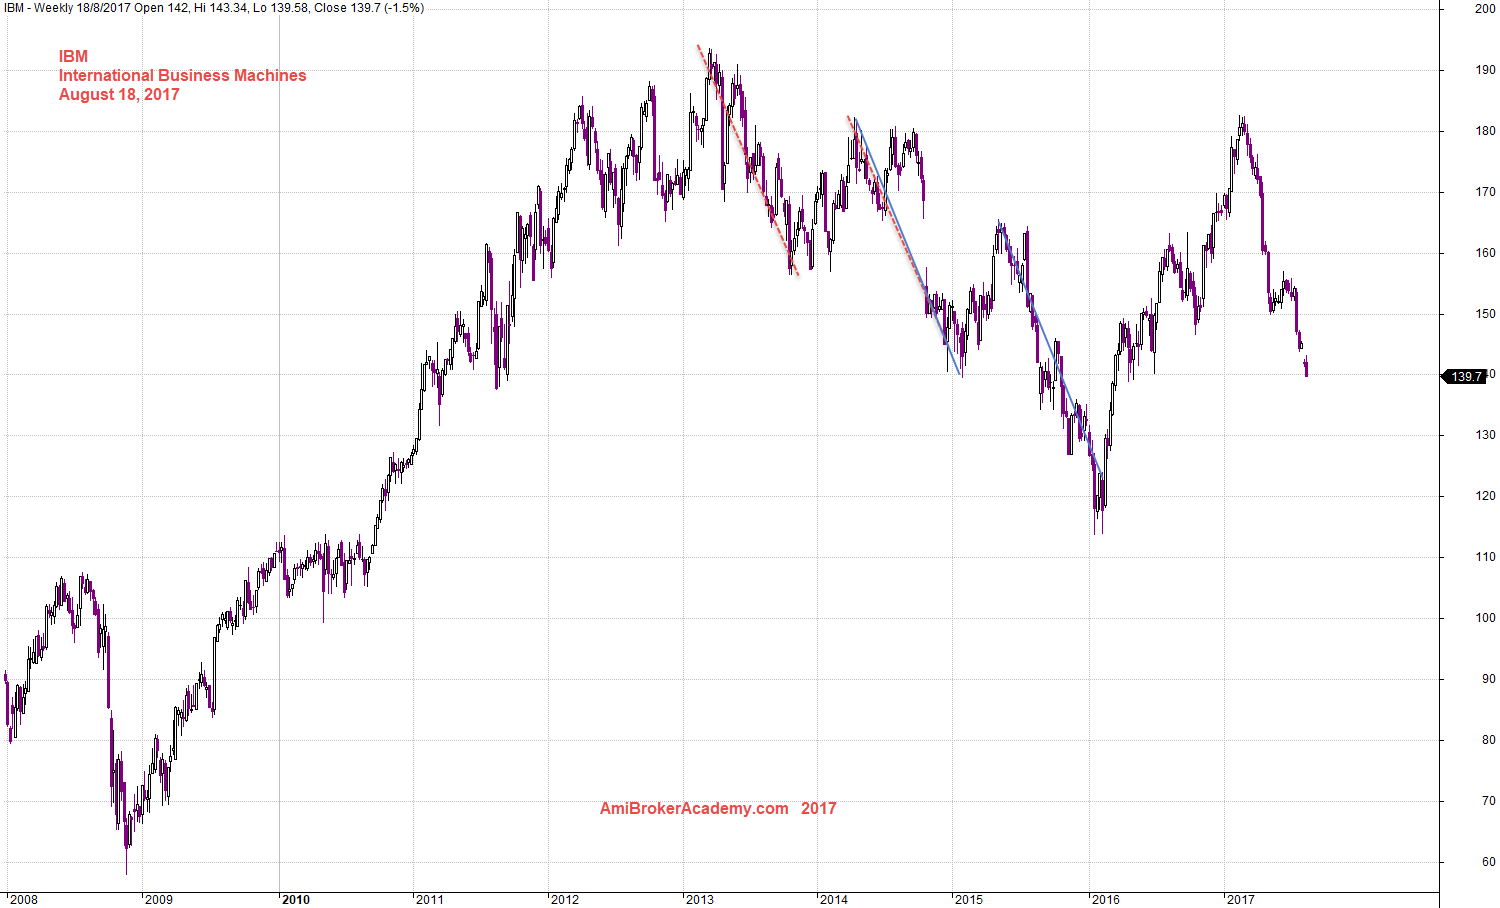
August 18, 2017 International Business Machines and Gartley ABCD Pattern
Thanks for visit the site here. You could also find free MACD scan here in this site too.
Moses
AmiBrokerAcademy.com
Disclaimer
The above result is for illustration purpose. It is not meant to be used for buy or sell decision. We do not recommend any particular stocks. If particular stocks of such are mentioned, they are meant as demonstration of Amibroker as a powerful charting software and MACD. Amibroker can program to scan the stocks for buy and sell signals.
These are script generated signals. Not all scan results are shown here. The MACD signal should use with price action. Users must understand what MACD and price action are all about before using them. If necessary you should attend a course to learn more on Technical Analysis (TA) and Moving Average Convergence Divergence, MACD.
Once again, the website does not guarantee any results or investment return based on the information and instruction you have read here. It should be used as learning aids only and if you decide to trade real money, all trading decision should be your own.