November 2, 2016
^HSI | Hong Kong Hang Seng Index and 34 EMA Wave
After two months of bullish trend, the index start to move side way. Now the index get weaker.
34 EMA wave is a great visual too for chart analysis, it is very easy to spot the reversal; the index start to cross and close below the wave. At the same time, we can easily spot the wave to band down and pointing down.
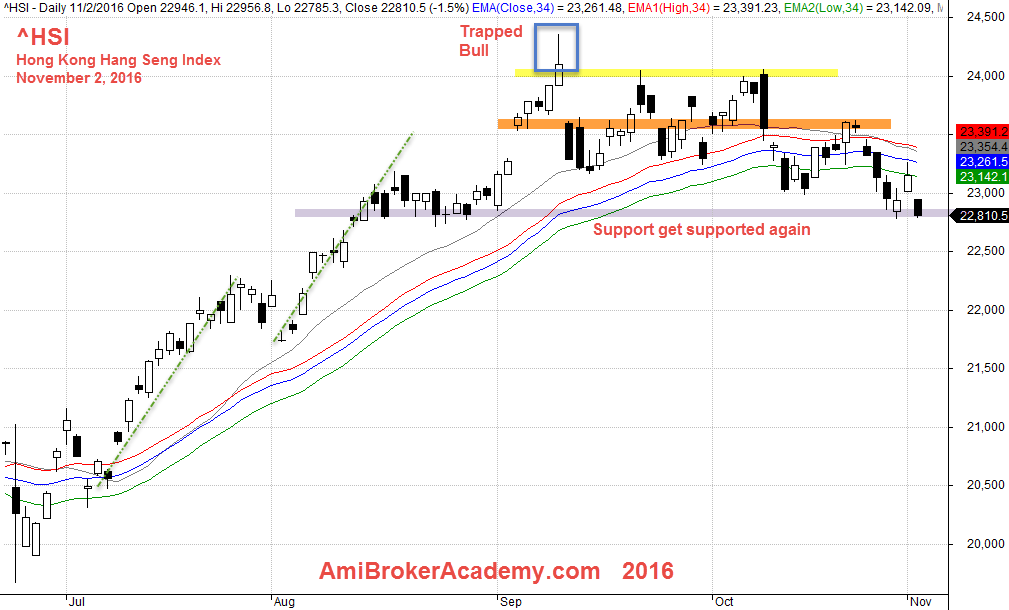
November 2, 2016 Hong Kong Hang Seng Index Daily and 34 EMA Wave
^HSI | Hong Kong Hang Seng Index and ABCD Chart Pattern
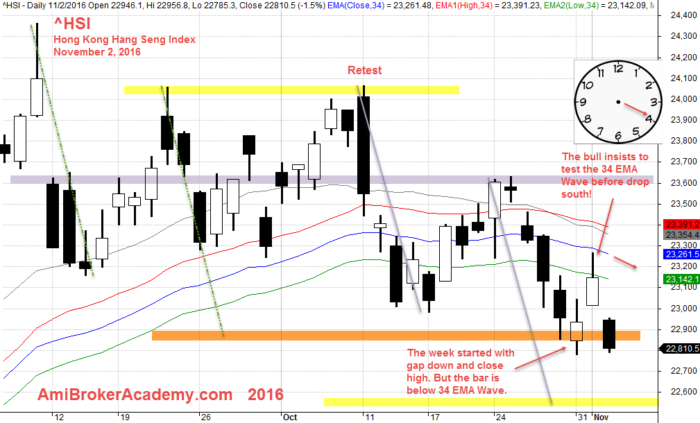
November 2, 2016 Hang Seng Index Daily and ABCD Chart Pattern
Zoom in to read the chart closer. The index retest the 34 Wave before begin to travel south. True or true. Will see.
Have fun!
Moses Stock Desk
AmiBrokerAcademy.com
Disclaimer:
The discussion here is for educational purposes only. All information, data, symbols and trading ideas discussed by the author or authors are for demonstration or illustration purposes only and are not recommendations. It is not to be construed or intended as providing trading or legal advice.
This discussion is not an offer or solicitation of any kind in any jurisdiction where any AmiBrokerAcademy.com or its affiliate is try to do business.
Please note that active trading is not suitable for everyone. Decisions you make about your trading or investment are important to you and your family, therefore should be made in consultation with a competent financial advisor or professional. We are not financial advisor and do not claim to be.
Any views expressed here-in are not necessarily those held by amibrokeracademy.com.
We do not represent the external reference, or reference. We can not be responsible for their views and site availability.