November 30, 2017
Singapore Stock Analysis
Not What You Think But How You Think
Always Start With Big Picture Do Not Fire From Your Hip
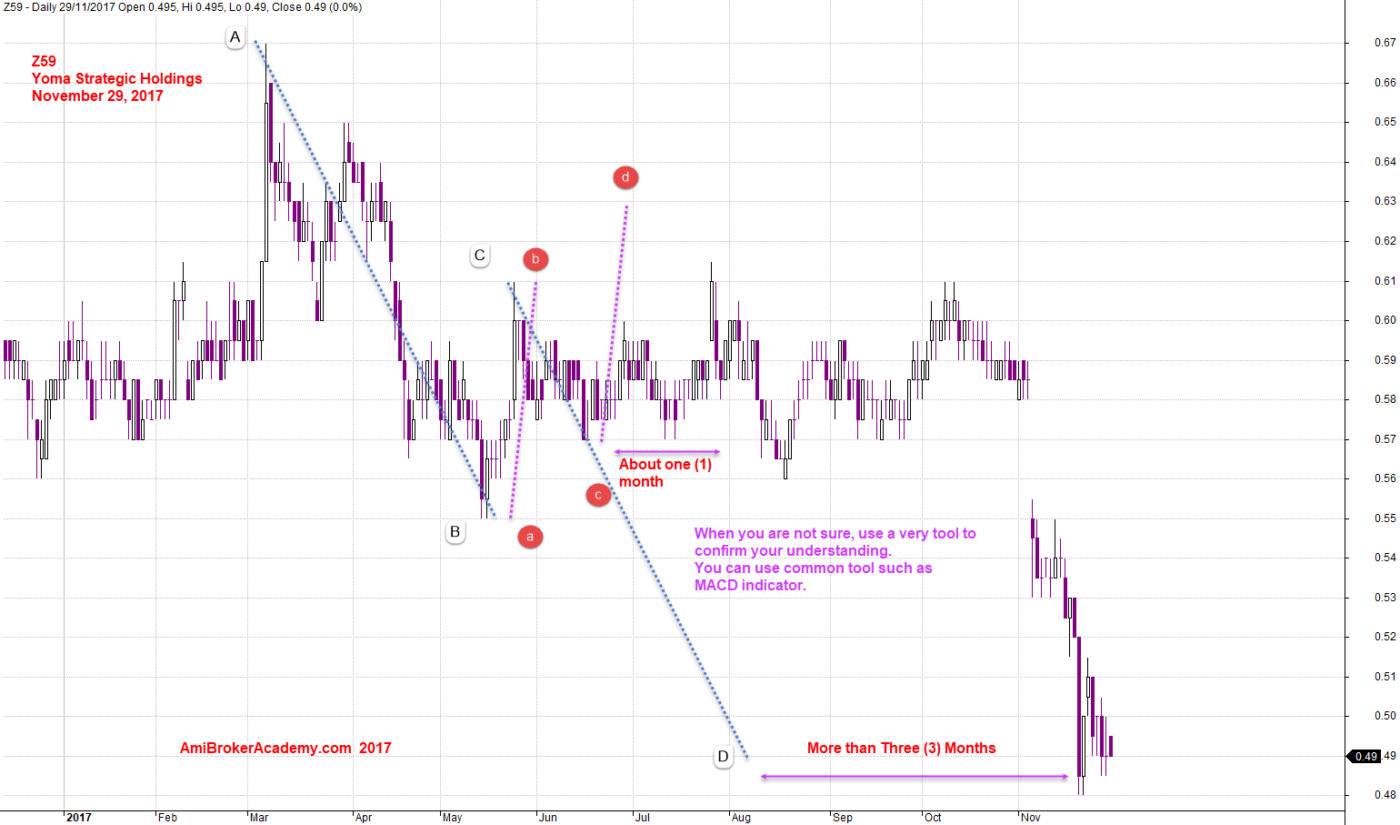
You start your trade plan with a big picture, most of the time for stock trading you need more data to see the trend. There is not fixed rules, but increase the data until you see something. For the example below, you see a high, and then the price keeps falling. This observation provides you an understanding the stock are bearish, therefore find a good upflow and followed a fail breakout higher, the downflow consider AB leg, after a retrace up and the price still below the last high. You can start planning to trade strategy such as 1) trade CD leg, 2) trade ABCD buy.
Read the example using Yoma as an example in getting confirmation on our understanding.
The narrative is how you think. So, don’t just think (what you think). In fact many great traders such as Larry Pesavento, Leslie Jouflas are having such great discipline in planning their trades. Enjoy learning. You can find out more their book published in 2004, Essentials of Trading: It’s Not WHAT You Think It’s HOW You Think, by Traders Press Inc.
The following charts are produce from AmiBroker Chart Software. AmiBroker is one of the great powerful charting software in the last ten years.
Yoma Strategic Holdings and ABCD Pattern
You see trading has been not an easy task. It’s is not like everybody think (even some Gurus), why? See the chart below, from the big picture, you see a potential ABCD down, can you see the big ABCD pattern, it took more than three months for the CD leg to complete. In between, in fact you could identify number of smaller ABCD pattern.
Now, trading before you take your stand and begin either to buy or sell. It is great if you have enough energy to find the confirmation. The confirmation provide you with more confident if everything just happen the way it should. And you know well enough, all setup can fail. So, sometime there are trader after confirmation, they take another effort to double confirm. KAISU, See chart after this chart for how we take confirmation. Enjoy learning.
KAISU
KIASU is a Singlish (Singapore English). It is from a Hokkien (one of the Chinese dialects) word that means a grasping, selfish attitude. In English, KAISU means “afraid to lose out”.
November 29, 2017 Yoma Strategic Holdings and ABCD Pattern
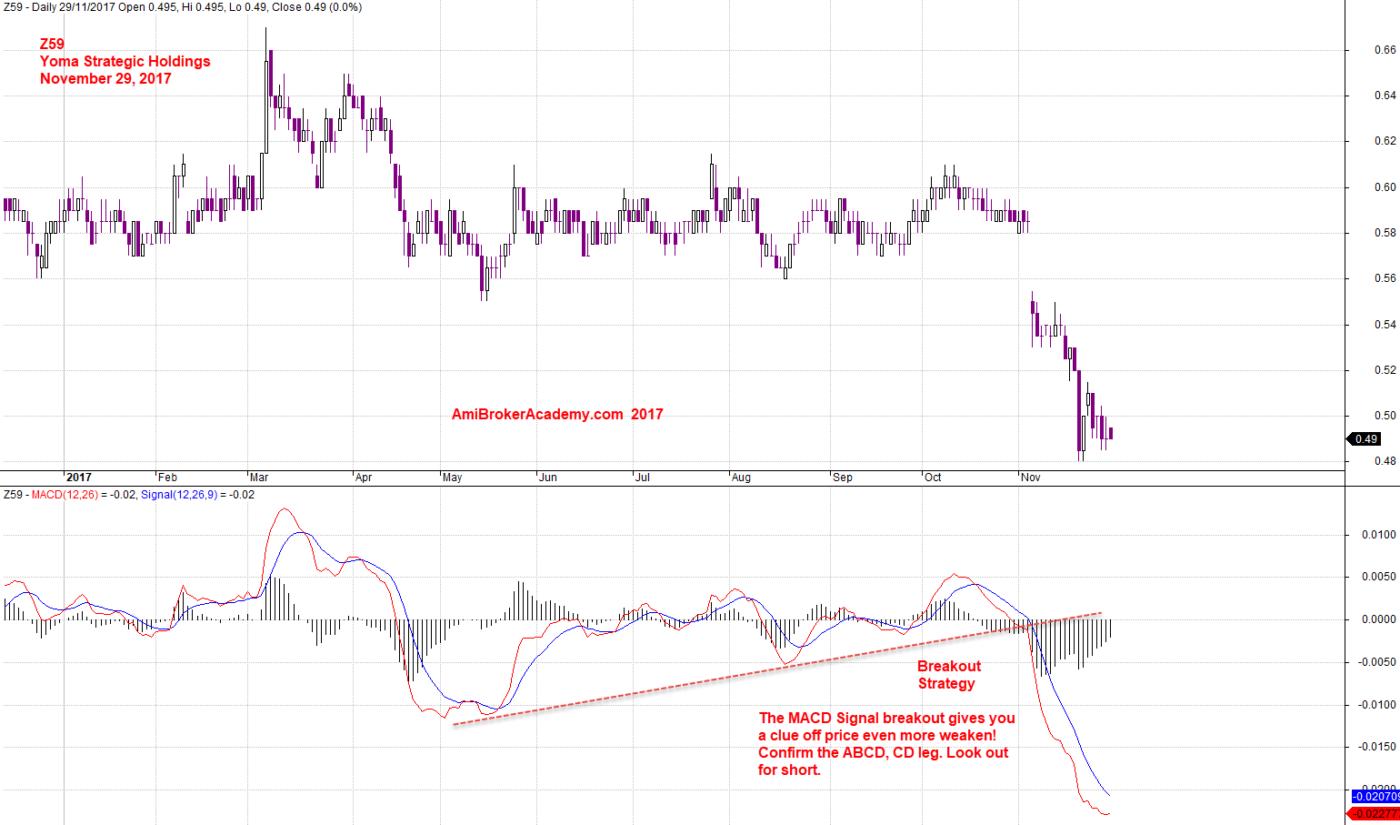
Yoma Strategic Holdings and MACD Indicator
Took the same chart, add the MACD indicator. You could do this easily in AmiBroker charting software. In fact AmiBroker by default provides you with eight sheets, you could use one of the sheet to set the MACD indicator, so you could preserve your original trade plan. You could move back and for any of the eight charts. You could try this out from AmiBroker software offering. Check it out from AmiBroker.com down load.
We are looking for confirmation on bearish trend, so we can feel comfortable to short the stock. From the MACD signals, you could see MACD signals such as MACD Cross Down Signals, MACD Cross Down Zeroline, and so on. These provides you with more understanding in your observation, studying the chart.
Next you may also understand is, in trading never rush. Of course you may miss the trade. It is okay. But most of the time you should have enough time to plan. Because of KAISU, and KAISI. Some may wait for the right moment to enter the trade.
Now you have big picture of bearish, and like to trade the CD leg. Either you short high. wait for the price action to retrace back to near C or somewhat near C before you enter the trade. Or some will wait to let the price action go below B and retest B.
There are no right no wrong in trading. It all depending on your trading experience.
KAISI
KAISI is a Hokkien phrase, literally means afraid of death, to describe the attitude of being overly afraid or timid.
November 29, 2017 Yoma Strategic Holdings and MACD Breakout
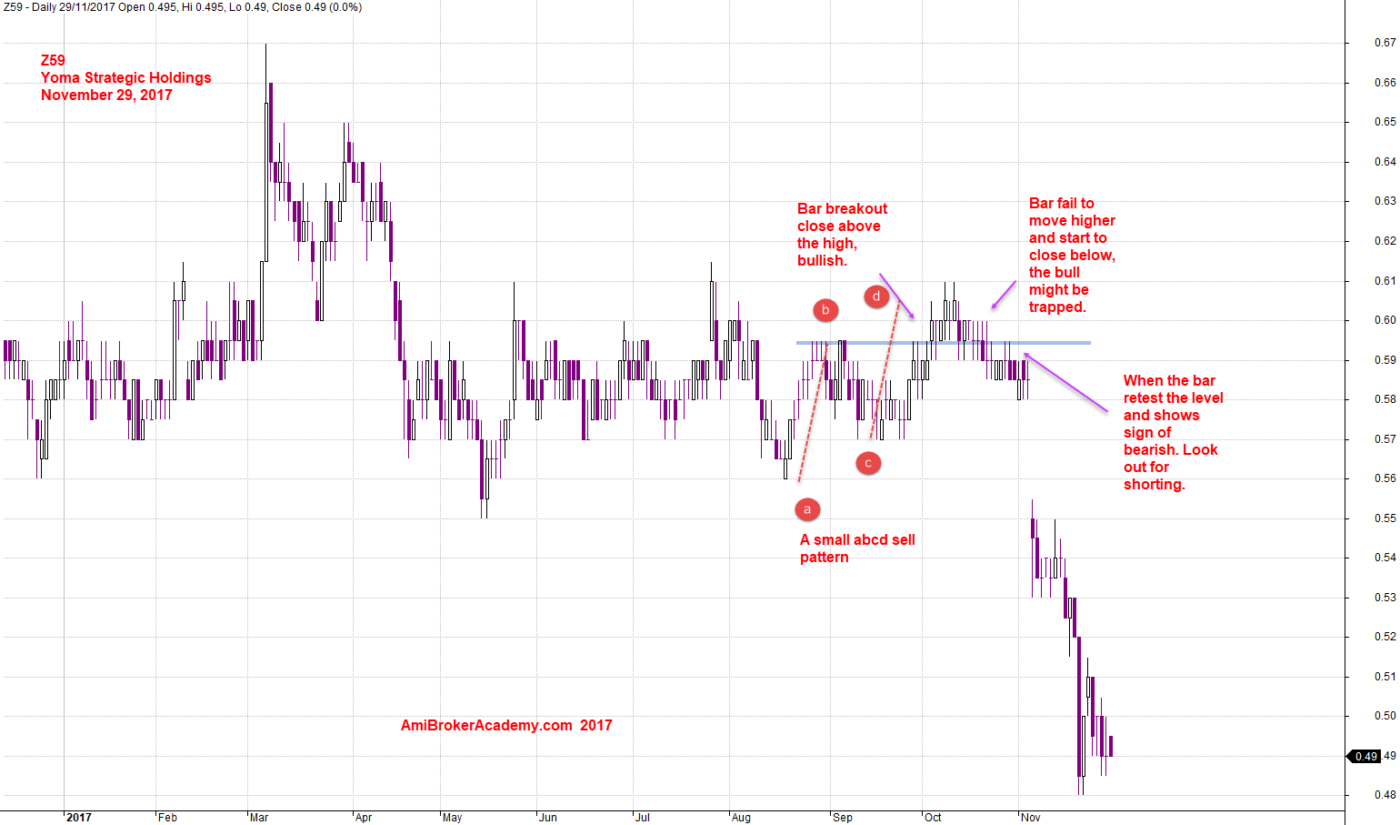
Yoma Strategic Holdings and Bar by Bar
For those whom are very careful, I do not mean KAISU, KAISI. They may study the chart in great detail. They try to understand every move of the stock price to understand what the market emotions of this particular stock. We provide some of the analysis here. Read the chart for more.
November 29, 2017 Yoma Strategic Holdings and Bar by Bar
Moses
AmiBrokerAcademy.com
Disclaimer
The above result is for illustration purpose. It is not meant to be used for buy or sell decision. We do not recommend any particular stocks. If particular stocks of such are mentioned, they are meant as demonstration of Amibroker as a powerful charting software and MACD. Amibroker can program to scan the stocks for buy and sell signals.
These are script generated signals. Not all scan results are shown here. The MACD signal should use with price action. Users must understand what MACD and price action are all about before using them. If necessary you should attend a course to learn more on Technical Analysis (TA) and Moving Average Convergence Divergence, MACD.
Once again, the website does not guarantee any results or investment return based on the information and instruction you have read here. It should be used as learning aids only and if you decide to trade real money, all trading decision should be your own.