January 24, 2017
Stock Analysis – Hong Kong Stock Benchmark – ^HSI
Hong Kong Stock Hang Seng Index Monthly Chart – Data from 1988 to 2017
With key levels and areas marked. Can this help in plan the new year trading strategy? Data from Yahoo! Finance.
Let study the following one of the Asia key market index for the 2017.
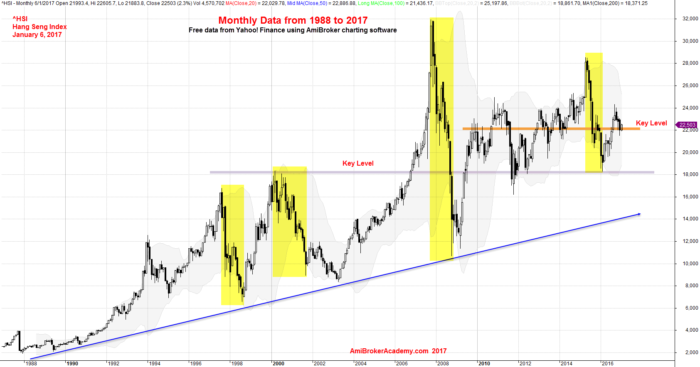
January 6, 2017 Hong Kong Hang Seng Index Monthly Data from 1988 to 2017
AmiBroker is a powerful charting software, as long as you have the data, the software can do wonder.
Moses Stock Scan
AmiBrokerAcademy.com
Disclaimer
The above result is for illustration purpose. It is not meant to be used for buy or sell decision. We do not recommend any particular stocks. If particular stocks of such are mentioned, they are meant as demonstration of Amibroker as a powerful charting software and MACD. Amibroker can program to scan the stocks for buy and sell signals.
These are script generated signals. Not all scan results are shown here. The MACD signal should use with price action. Users must understand what MACD and price action are all about before using them. If necessary you should attend a course to learn more on Technical Analysis (TA) and Moving Average Convergence Divergence, MACD.
Once again, the website does not guarantee any results or investment return based on the information and instruction you have read here. It should be used as learning aids only and if you decide to trade real money, all trading decision should be your own.