November 14, 2017
Hong Kong Hang Seng Index Charting
See chart for more, HSI has breakout higher 2015 high. Where will the level stop? Do you know?
See the next chart for some idea.
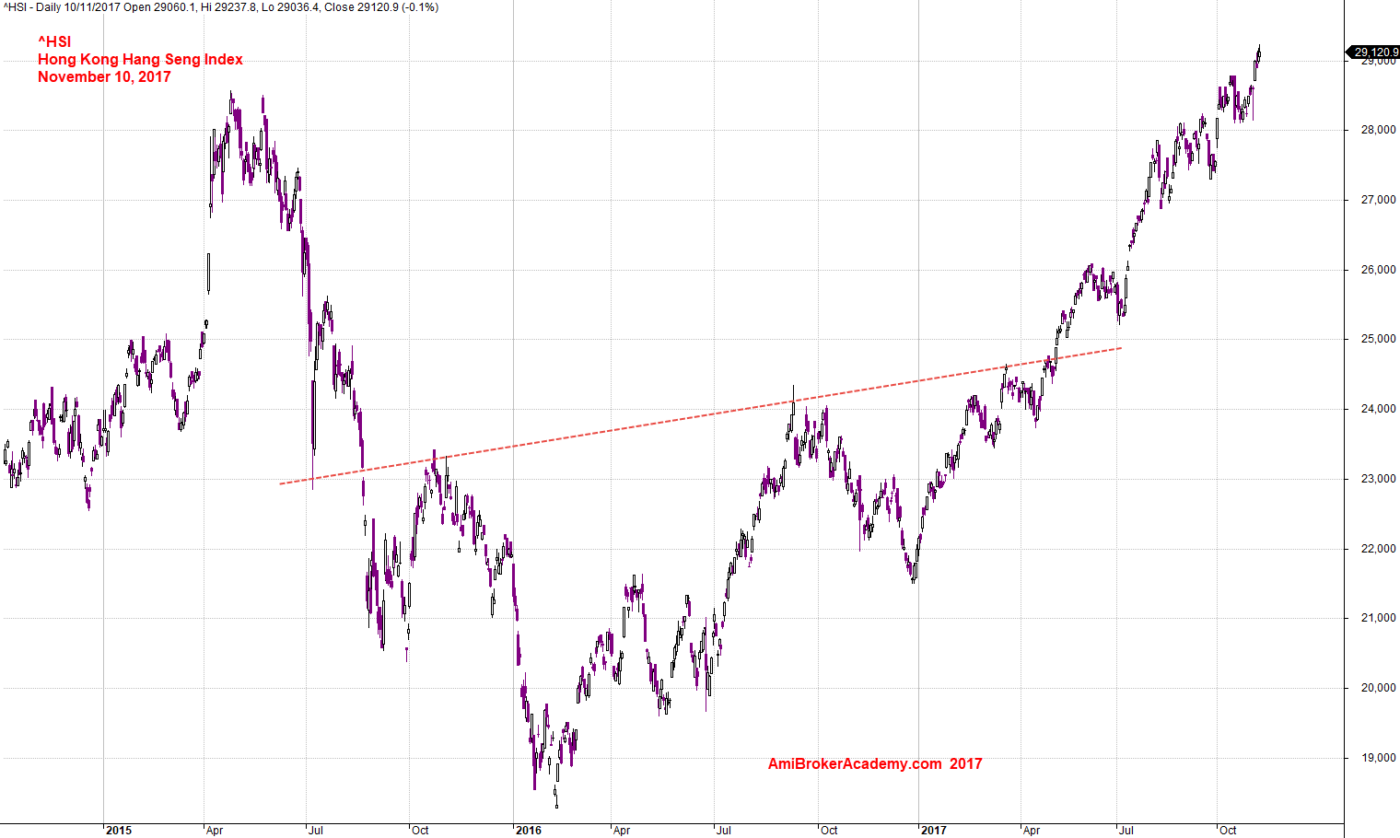
November 10, 2017 Hong Kong Hang Seng Index Charting
Hong Kong Hang Seng Index and ABCD Patterns
See chart for more.
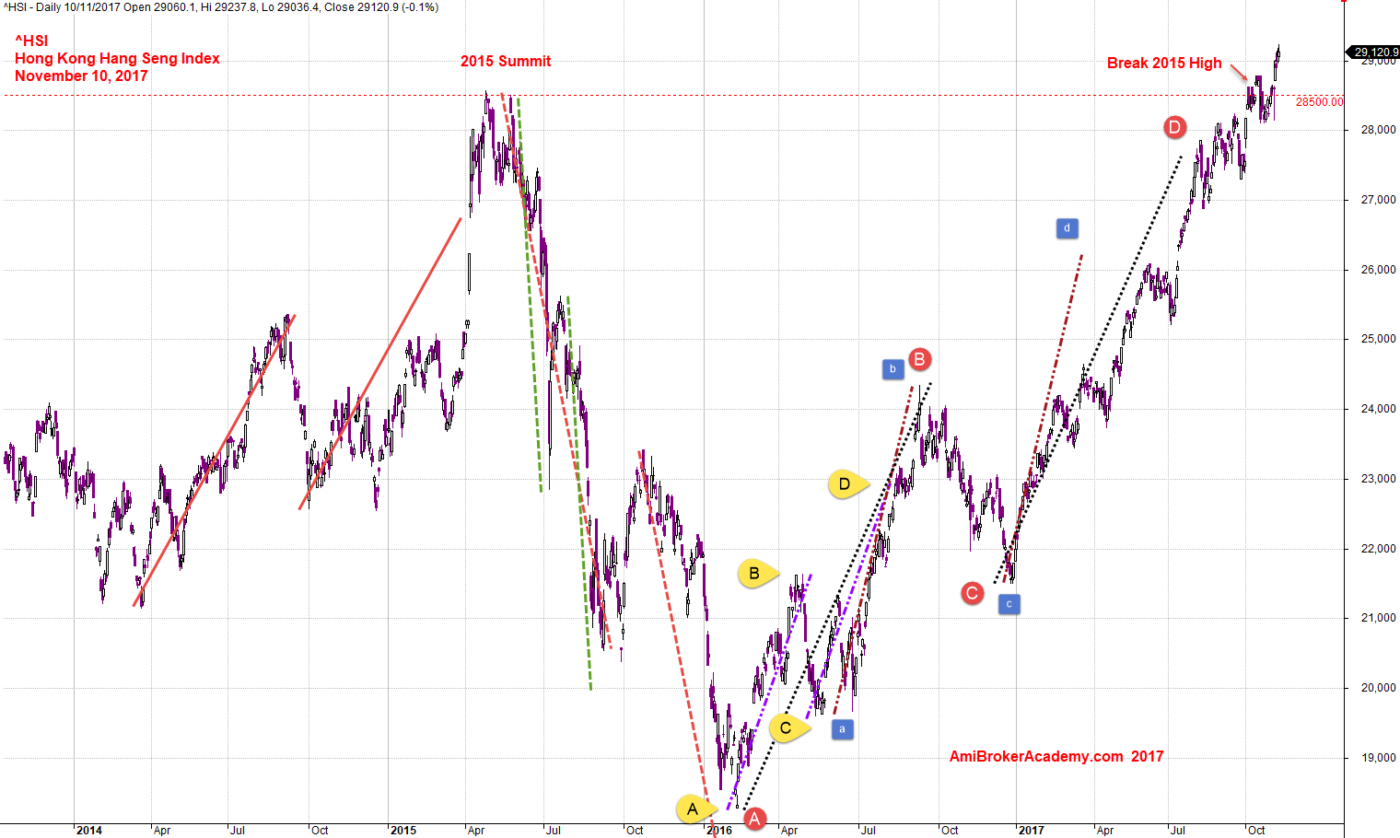
November 10, 2017 Hong Kong Hang Seng Index and ABCD Patterns
Hong Kong Hang Seng Index and Bottoms
See chart for more.
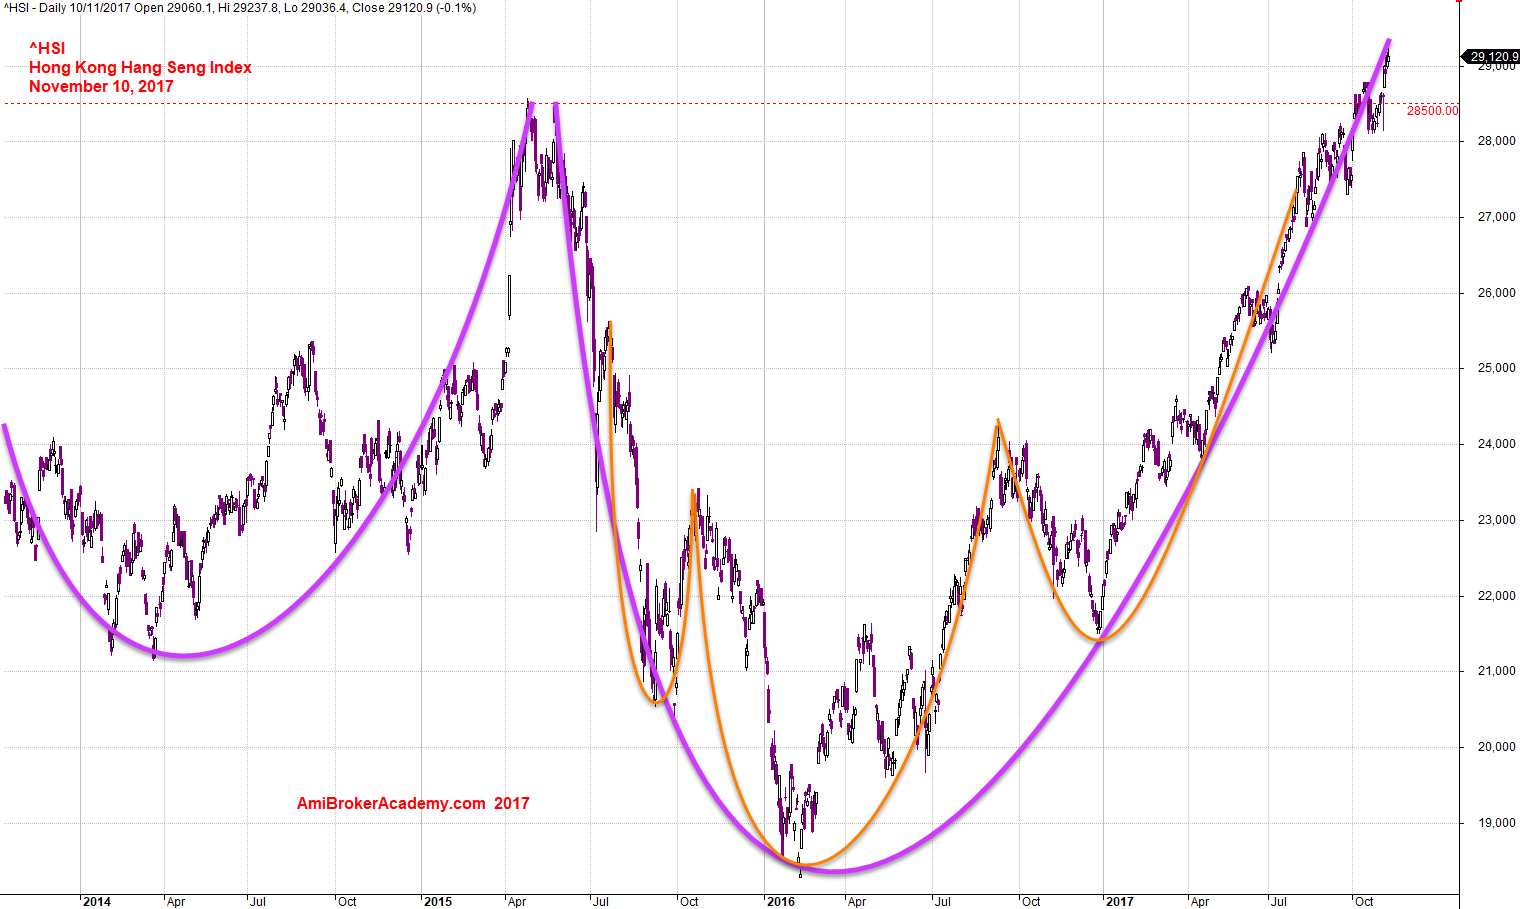
November 10, 2017 Hong Kong Hang Seng Index and Bottoms
Moses
AmiBrokerAcademy.com
Disclaimer
The above result is for illustration purpose. It is not meant to be used for buy or sell decision. We do not recommend any particular stocks. If particular stocks of such are mentioned, they are meant as demonstration of Amibroker as a powerful charting software and MACD. Amibroker can program to scan the stocks for buy and sell signals.
These are script generated signals. Not all scan results are shown here. The MACD signal should use with price action. Users must understand what MACD and price action are all about before using them. If necessary you should attend a course to learn more on Technical Analysis (TA) and Moving Average Convergence Divergence, MACD.
Once again, the website does not guarantee any results or investment return based on the information and instruction you have read here. It should be used as learning aids only and if you decide to trade real money, all trading decision should be your own.