April 9, 2017
Welcome to Moses’s Stock Analysis @ AmiBrokerAcademy.com.
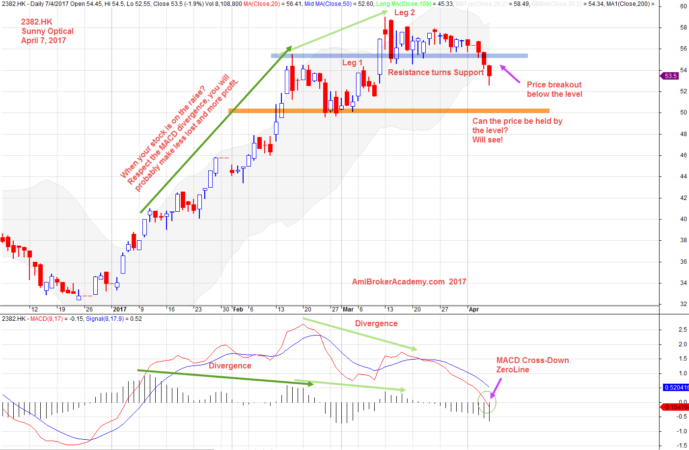
We check on this stock, because of the signal pop up in our stock scan, our MACD Screening. No magic. We can’t read from the thin air. It is all scientific approach. Check the analysis that follows.
Hong Kong 2382.HK Sunny Optical Charting and MACD Indicator
Study the chart, you see the price starts from the bottom left and move up to right top. It is clearly a uptrend. MACD has kept signal a trend ending.
Price start to has a deeper retracement or pullback. Trend continue again. Visually, now the trend has a even deeper retracement. Can the trend continue a gain. Well. It all depends.
Taking the fact that the price breakout lower than the last resistance turns support. Can the next support continue to be a good support. Wait till it get supported then we will know.
MACD has signal a MACD Cross Dow Zeroline.
April 7, 2017 Sunny Optical Daily – Hong Kong Stock
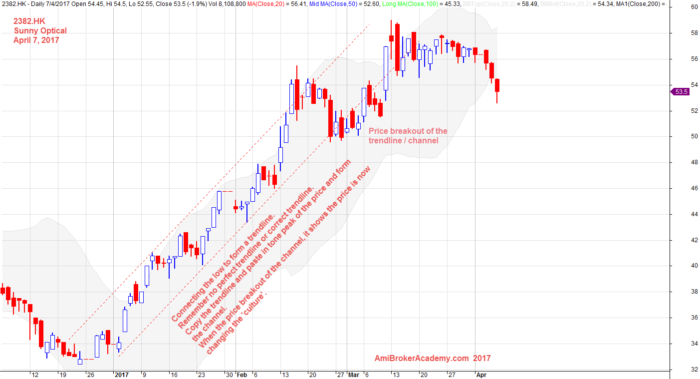
2382.HK Sunny Optical Charting and Channel
Connecting the low and forms the trendline, copy and pasted the line on the tip of some price will form the channel. The price will contains with the channel until the price structure change. So, the price will start a new structure after the breakout.
Trade what you see. We wee double top, we see the price is approaching the neckline. …
Wait, if you plan to buy. Take some profit if you already holding the stock. …
Form your own trading plan and strategy.
On what basis, you think the trend will continue. Or on what basis, you think this is a true reversal.
Do you need more indicator to help you? Enjoy your learning.
April 7, 2017 SunnyOptical and Channel
Moses
AmiBrokerAcademy.com
Disclaimer
The above result is for illustration purpose. It is not meant to be used for buy or sell decision. We do not recommend any particular stocks. If particular stocks of such are mentioned, they are meant as demonstration of Amibroker as a powerful charting software and MACD. Amibroker can program to scan the stocks for buy and sell signals.
These are script generated signals. Not all scan results are shown here. The MACD signal should use with price action. Users must understand what MACD and price action are all about before using them. If necessary you should attend a course to learn more on Technical Analysis (TA) and Moving Average Convergence Divergence, MACD.
Once again, the website does not guarantee any results or investment return based on the information and instruction you have read here. It should be used as learning aids only and if you decide to trade real money, all trading decision should be your own.