January 11, 2018
US Stock Analysis
COKE Coca-Cola Bottling Year High Low from 2008
Month or Year high low is a good reference for support resistance. The many year of the same support or resistance forms a strong level to break, when the level break the move will be explosive. See chart for the explosive move. See, after 2014 move, an explosive move.
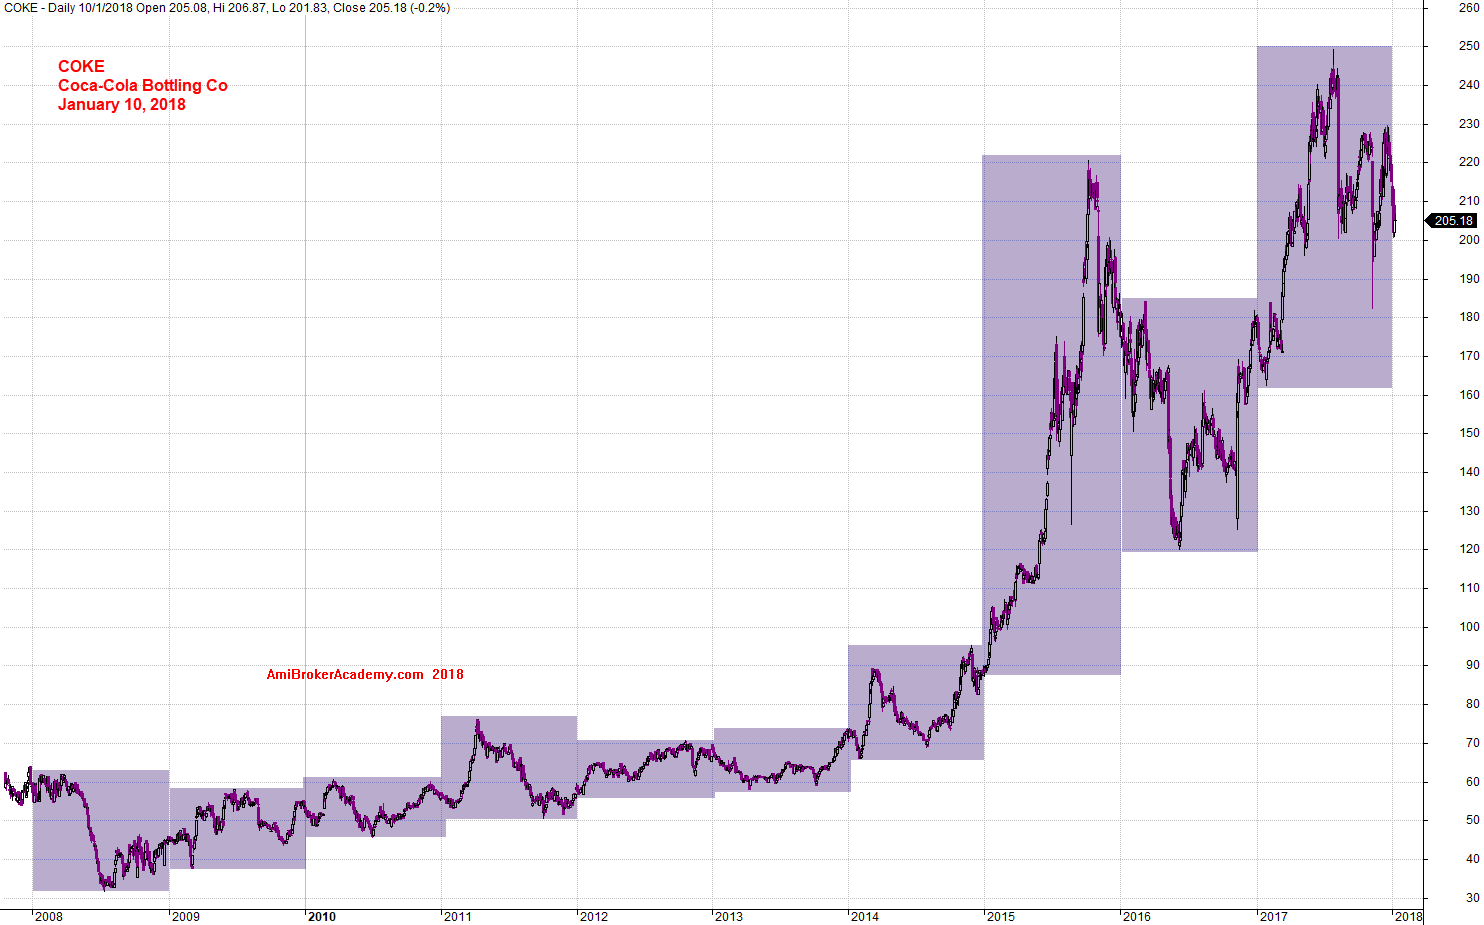
January 10, 2018 Coca-Cola Bottling Coke Year High Low
Powerful Chart Software – AmiBroker
The following chart is produced using AmiBroker charting software. It is a powerful chart software. You plot the stocks you are interested all in one chart, as long as you still could read them. See chart below.
COKE Coca-Cola Bottling and Apple Inc Correlation From 2008
Correlation is a good way to analyse the stock performance. See chart for high tech and low tech stock performance.
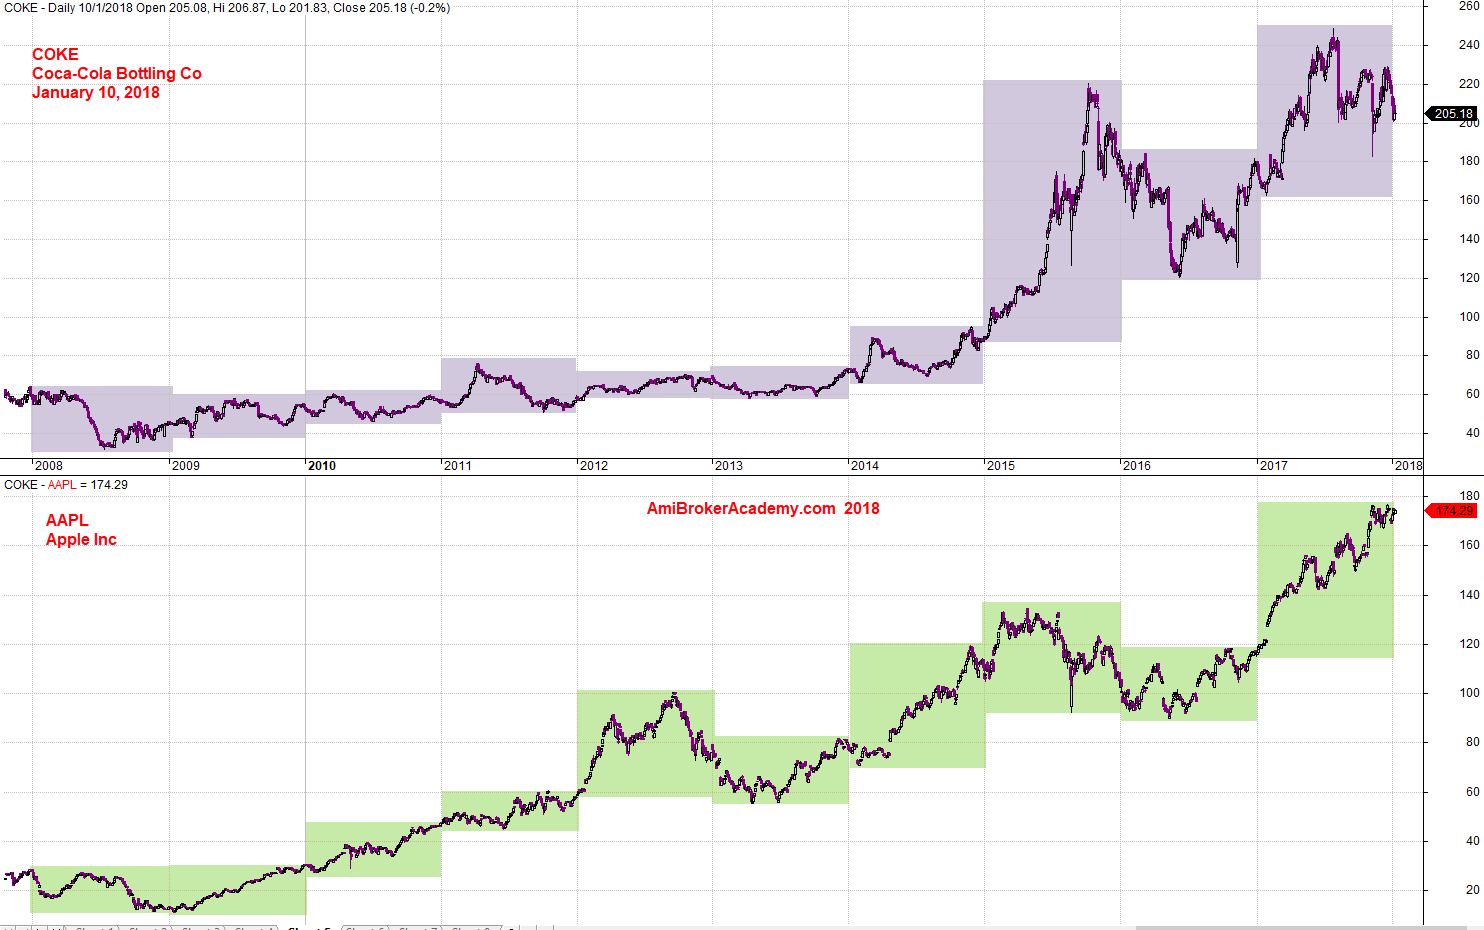
January 10, 2018 Coca-Cola Bottling and Apple Inc Correlation
Moses
AmiBrokerAcademy.com
Disclaimer
The above result is for illustration purpose. It is not meant to be used for buy or sell decision. We do not recommend any particular stocks. If particular stocks of such are mentioned, they are meant as demonstration of Amibroker as a powerful charting software and MACD. Amibroker can program to scan the stocks for buy and sell signals.
These are script generated signals. Not all scan results are shown here. The MACD signal should use with price action. Users must understand what MACD and price action are all about before using them. If necessary you should attend a course to learn more on Technical Analysis (TA) and Moving Average Convergence Divergence, MACD.
Once again, the website does not guarantee any results or investment return based on the information and instruction you have read here. It should be used as learning aids only and if you decide to trade real money, all trading decision should be your own.