September 4, 2017
H22 Hong Leong Asia and Support Resistance
Picture worth a thousand words. See chart, $1.45 is the max for this year so far. The price can not breakout higher. Now the price is testing 95 cents. 95 cents is resistance turns support. The price could struggle a bit before it break away, either higher or lower.
Trade with care.
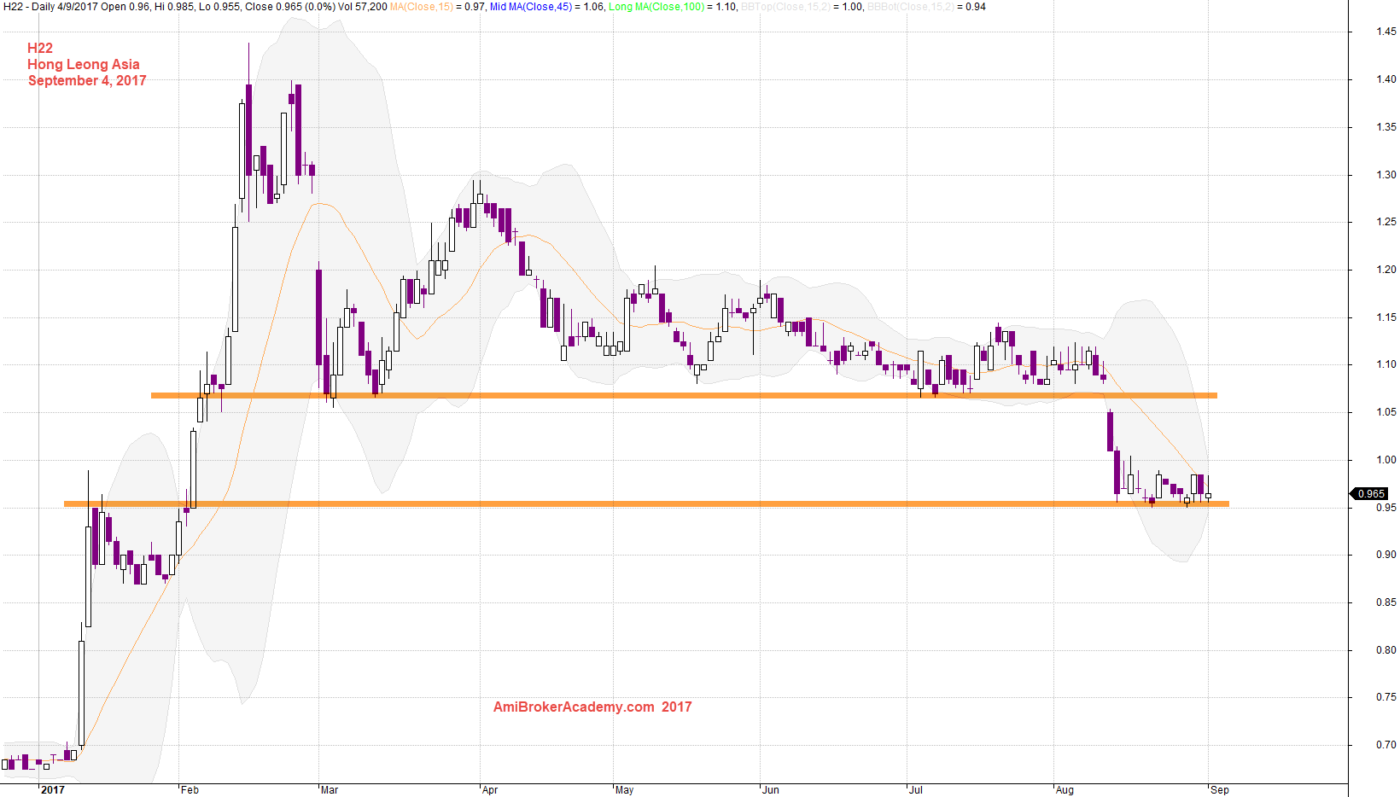
September 4, 2017 Hong Leong Asia and Support Resistance
H22 Hong Leong Asia and MACD Signal
Let see, what MACD signal shows us> MACD signal has gone for near zeroline to further from zeroline, bearish bias. If the MACD cross up happen and MACD cross up zeroline, the stock trend may be reversed. Will see.
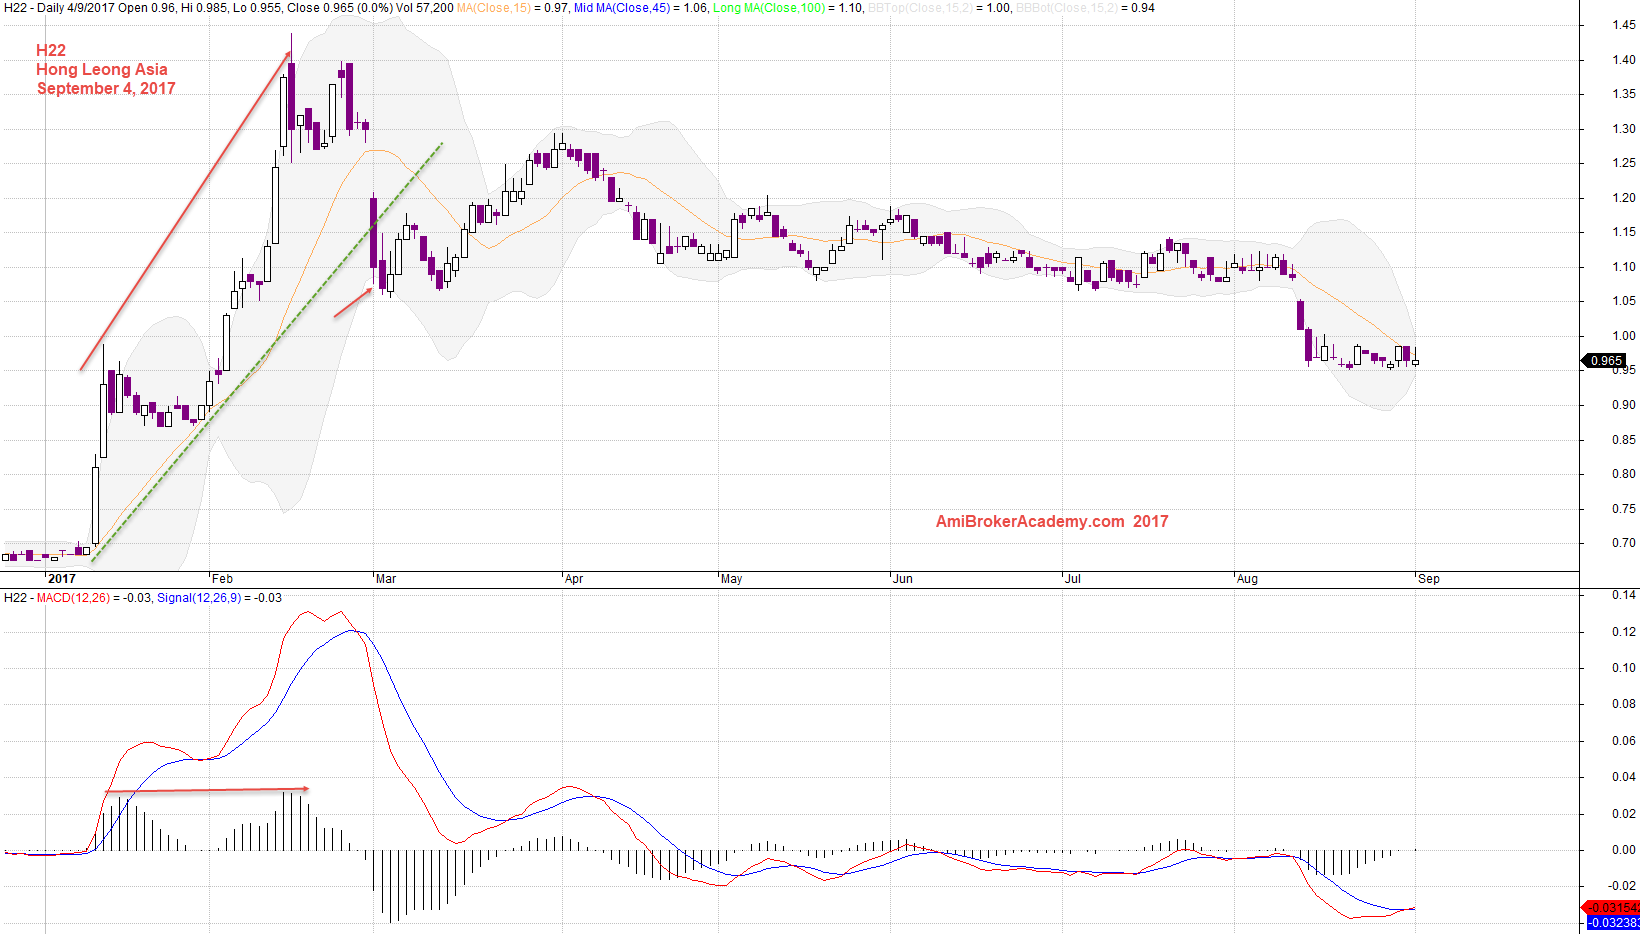
September 4, 2017 Hong Leong Asia and MACD
Thanks for visit the site here. You could also find free MACD scan here in this site too.
Moses
AmiBrokerAcademy.com
Disclaimer
The above result is for illustration purpose. It is not meant to be used for buy or sell decision. We do not recommend any particular stocks. If particular stocks of such are mentioned, they are meant as demonstration of Amibroker as a powerful charting software and MACD. Amibroker can program to scan the stocks for buy and sell signals.
These are script generated signals. Not all scan results are shown here. The MACD signal should use with price action. Users must understand what MACD and price action are all about before using them. If necessary you should attend a course to learn more on Technical Analysis (TA) and Moving Average Convergence Divergence, MACD.
Once again, the website does not guarantee any results or investment return based on the information and instruction you have read here. It should be used as learning aids only and if you decide to trade real money, all trading decision should be your own.