October 28, 2017
My Teacher
My teacher usually world not yell, but sometimes he would! He would ask, would you being fair to yourself? Is this the purpose you come to learn from me? With these statements, often would remind me, and up to now, I am still immensely benefited from it.
GTT Communications Inc and ABCD Pattern
Picture worth a thousand words, see chart. Price action starts to test 35 dollars level. Will See can the price action to breakout higher than 36 dollars.
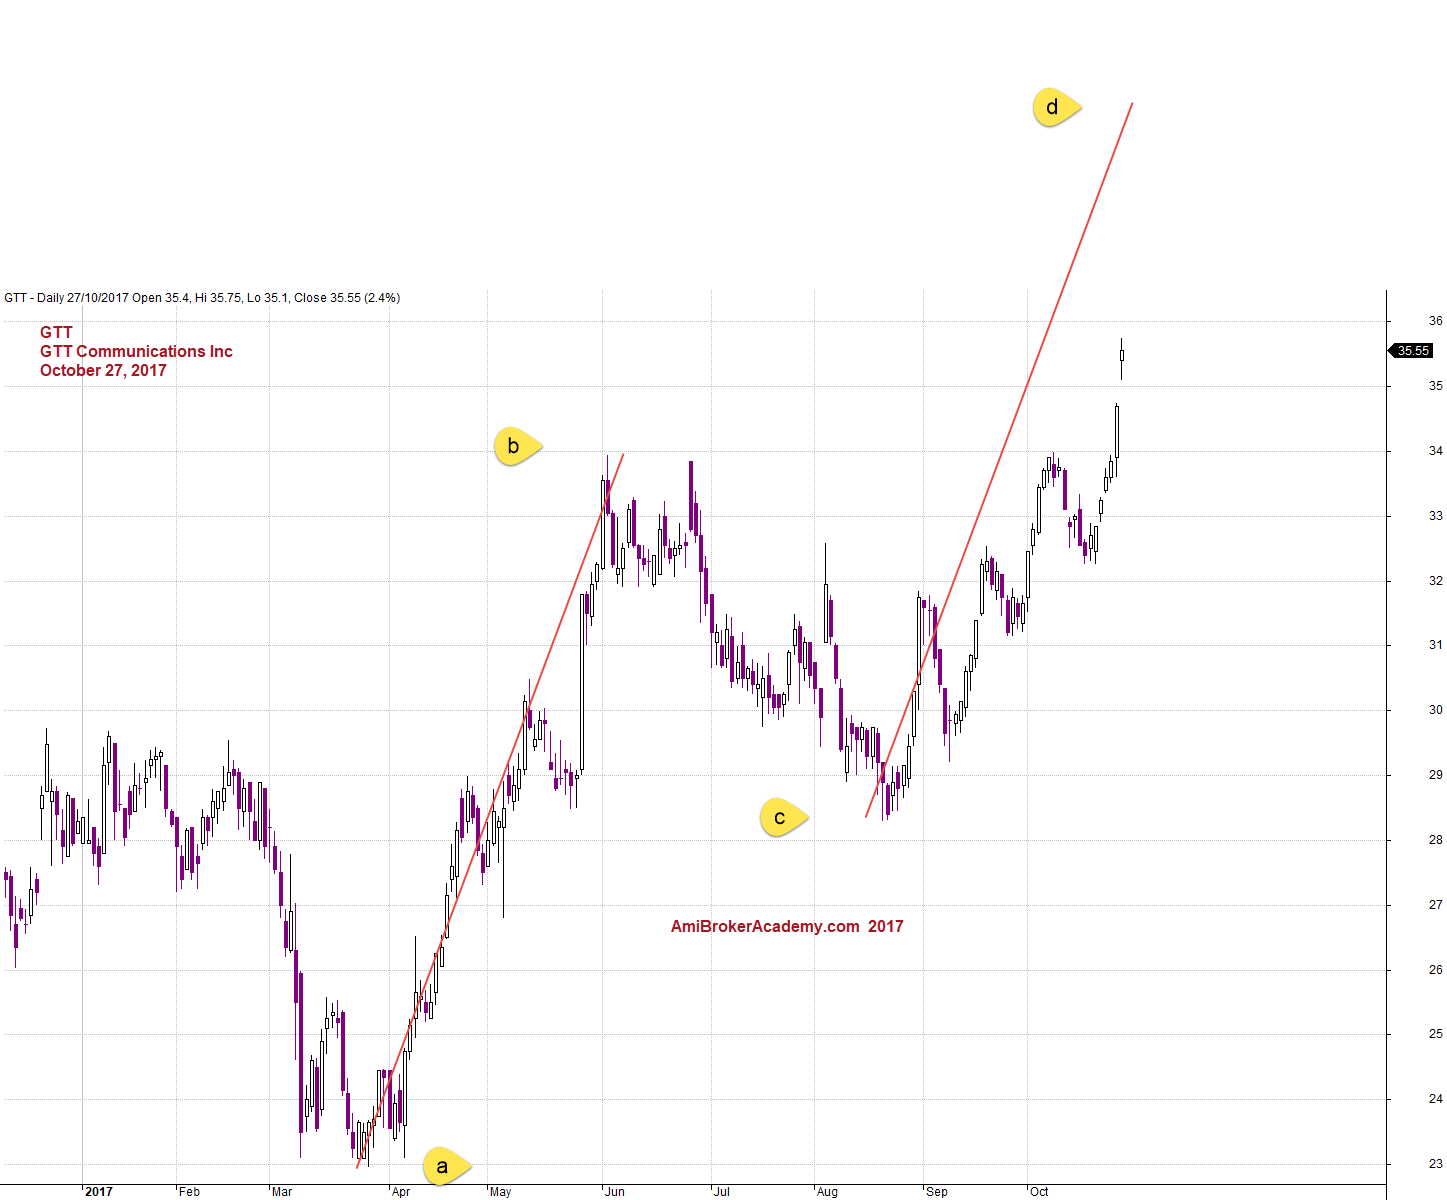
October 27, 2017 GTT Communications and ABCD Pattern
GTT Communications Inc and MACD Divergence
Picture worth a thousand words, see chart.
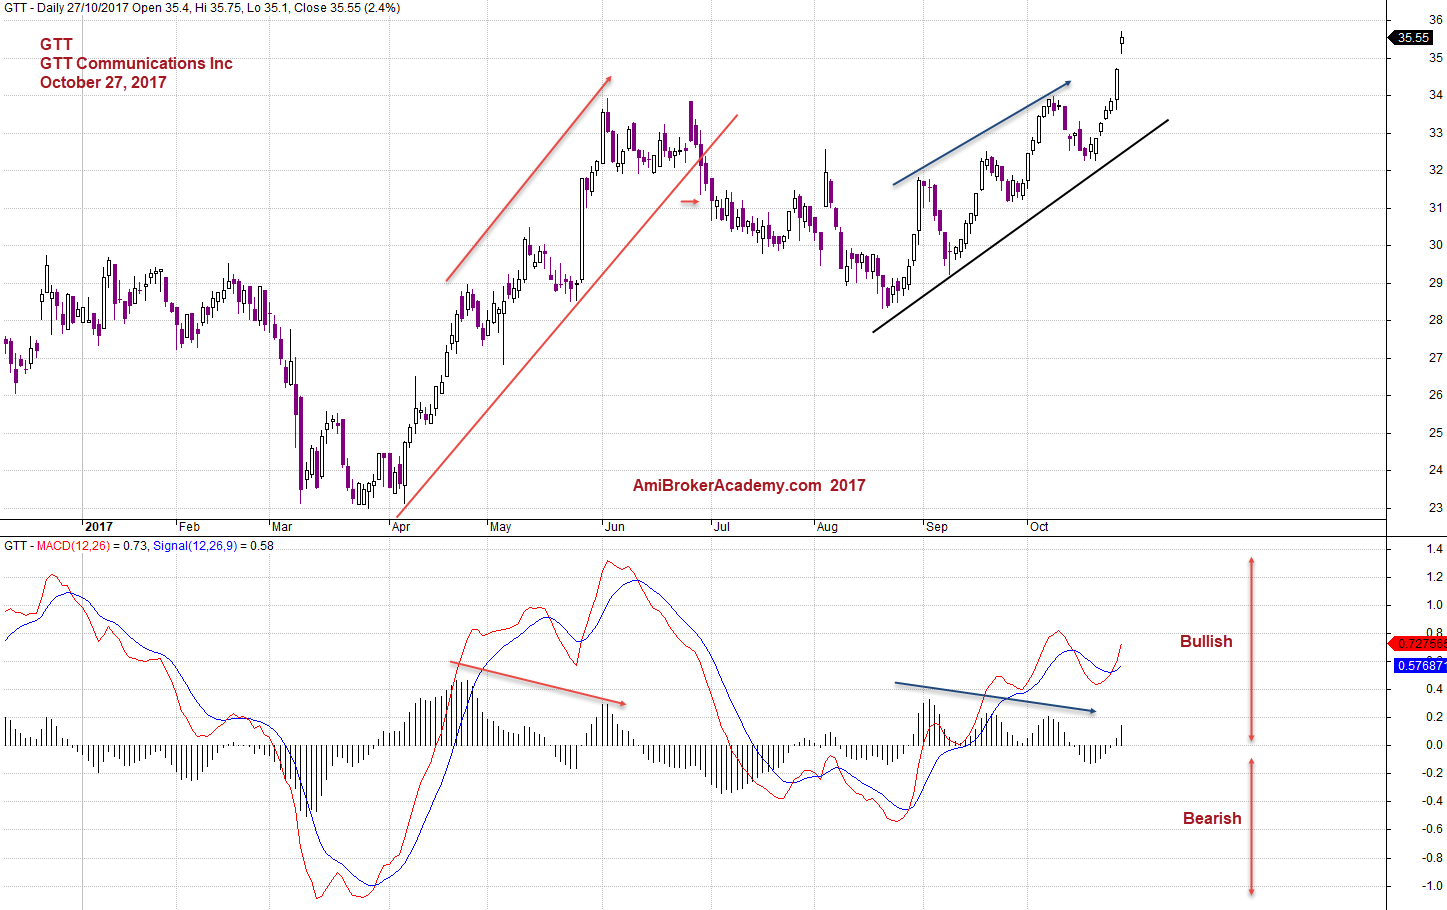
October 27, 2017 GTT Communications and MACD Divergence
Moses
AmiBrokerAcademy.com
Disclaimer
The above result is for illustration purpose. It is not meant to be used for buy or sell decision. We do not recommend any particular stocks. If particular stocks of such are mentioned, they are meant as demonstration of Amibroker as a powerful charting software and MACD. Amibroker can program to scan the stocks for buy and sell signals.
These are script generated signals. Not all scan results are shown here. The MACD signal should use with price action. Users must understand what MACD and price action are all about before using them. If necessary you should attend a course to learn more on Technical Analysis (TA) and Moving Average Convergence Divergence, MACD.
Once again, the website does not guarantee any results or investment return based on the information and instruction you have read here. It should be used as learning aids only and if you decide to trade real money, all trading decision should be your own.