April 7, 2017
Moses Stock Trading Blog Site – AmiBrokerAcademy.com
Thank you for visiting the amibrokeracademy.com blog site gives you more trading ideas.
Welcome to Moses’s US Stock Analysis @ AmiBrokerAcademy.com.
Many may thought this is a Singapore stocks site. No. We look at number of markets. As long as we could download the data from the Yahoo! Finance site. Yahoo! Finance provides free stock data. Thank you Yahoo!
You may get mislead by the Alexa Traffic Ranking. It shows 100% traffic comes from Singapore.
GS Goldman Sachs Group and Channels
In stead of draw only trendline, copy the same line and paste below or above the price action to form channel. In this case, you bound the price action within the two lines.
Price will move within the two lines until it breakout. Picture worth a thousand words.
We see the price breakout below the last low, and turn the support to become support again. Can the support strong enough to hold the price further. Will see.
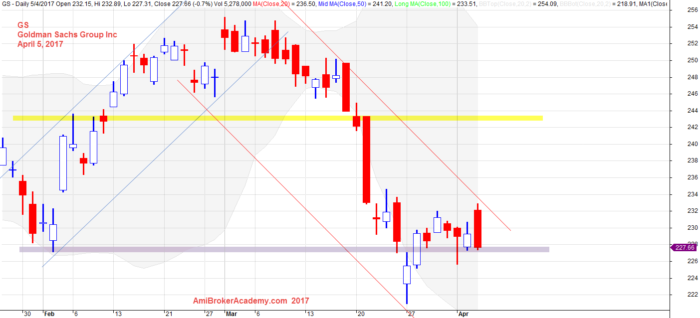
April 5, 2017 Goldman Sachs Group and Channels
GS Goldman Sachs Group and MACD Indicator
Add an indicator to help to analyse the chart, MACD is a good choice.
We see price continue to go higher, but MACD start to weaker. Indicator the price may not able to continue to move higher. If price can not to form higher high, it may be failing and move south.
True enough, the price start to go south. This why MACD is a leading indicator. Picture worth a thousand words.
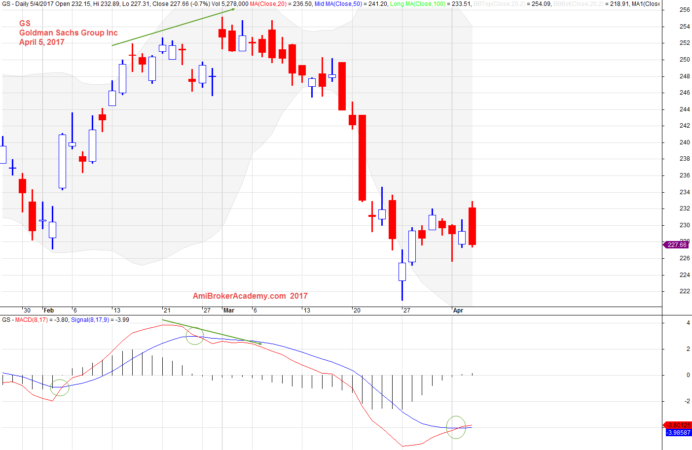
April 5, 2017 Goldman Sachs Group and MACD Indicator
Warning
Remember, trading is not a get rich fast business like many have advertised. It needs a lot of hard work and good money to manage risk.
Alice in wonderland, as Deepak Chopra always suggest, remember to remain childlike. Children will always amazes you on their encounter.
Trading has new adventure with the market remains unknown do not be blinded by anything you hear. Do you see forest or tree. Here we suggest you do not trade childlike, without being taught “fear”, do not know the limit like. Be aware, the market may look “sweet” but full of traps.
All traders must stay vigilant and trade carefully.
Picture worth a thousand words. It is your fate if you are here for the first time.
Happy learning.
Moses US Stock Analysis
AmiBrokerAcademy.com
Disclaimer
The above result is for illustration purpose. It is not meant to be used for buy or sell decision. We do not recommend any particular stocks. If particular stocks of such are mentioned, they are meant as demonstration of Amibroker as a powerful charting software and MACD. Amibroker can program to scan the stocks for buy and sell signals.
These are script generated signals. Not all scan results are shown here. The MACD signal should use with price action. Users must understand what MACD and price action are all about before using them. If necessary you should attend a course to learn more on Technical Analysis (TA) and Moving Average Convergence Divergence, MACD.
Once again, the website does not guarantee any results or investment return based on the information and instruction you have read here. It should be used as learning aids only and if you decide to trade real money, all trading decision should be your own.