February 7, 2018
Starting Friday 2nd February …
US market leading the sell off. We had studied Microsoft stock price action. How about Google? Do you want to know? Sure for me. We are going to check the GOOG as the next illustration to appreciate the sell off pressure. Have fun learning.
US Stock Analysis
GOOG Alphabet Inc Charting
See chart, gap down on Friday, February 2 and continue Monday, gap down further. Many traders that have not own a google stock sometime will think this is a best time t buy some. If one think that way, there are many have the same idea. So, the price first gap down, but right away the price rush up. See chart for more.
Guest what? Those whom have not take profit, quickly take the opportunity to sell off now. As these are the one that miss to sell on on Friday.
The next few days, depending on how many want to take profit or what to buy cheap. The momentum may continue.
If you are in a hurry, suggest you stand aside and watch for the opportunity. It may be in a few days, or may be it may be a few weeks.
Manage your risk!
Powerful Chart Software – AmiBroker
The following chart is produced using AmiBroker charting software. It is a powerful chart software. You plot the stocks you are interested all in one chart, as long as you still could read them. See chart below.
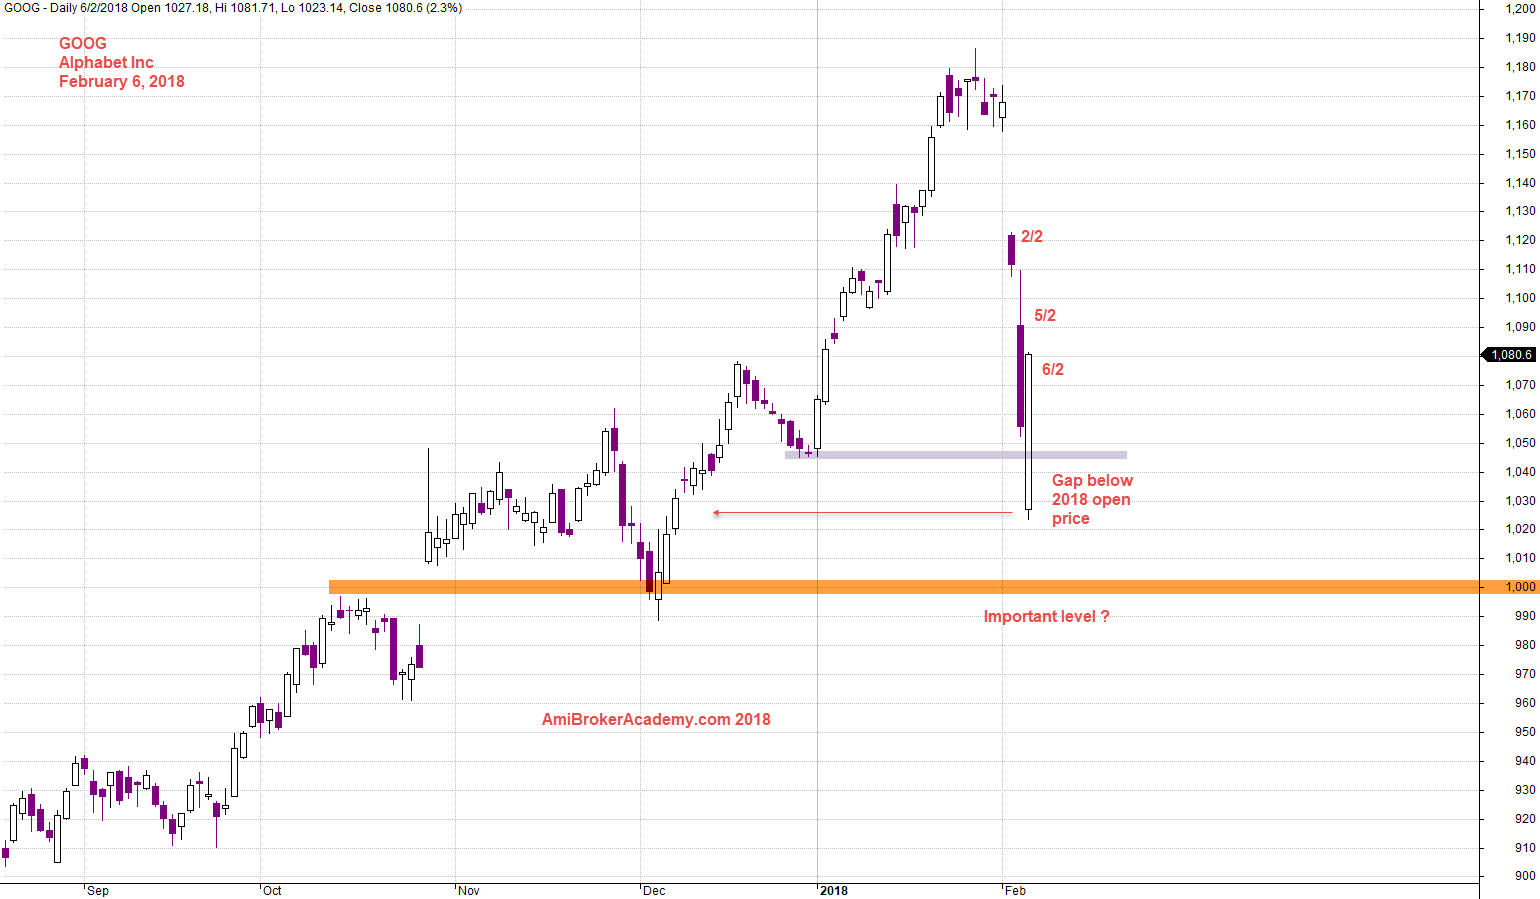
February 6, 2018 Alphabet Inc aka Google Charting
Moses
AmiBrokerAcademy.com
Disclaimer
The above result is for illustration purpose. It is not meant to be used for buy or sell decision. We do not recommend any particular stocks. If particular stocks of such are mentioned, they are meant as demonstration of Amibroker as a powerful charting software and MACD. Amibroker can program to scan the stocks for buy and sell signals.
These are script generated signals. Not all scan results are shown here. The MACD signal should use with price action. Users must understand what MACD and price action are all about before using them. If necessary you should attend a course to learn more on Technical Analysis (TA) and Moving Average Convergence Divergence, MACD.
Once again, the website does not guarantee any results or investment return based on the information and instruction you have read here. It should be used as learning aids only and if you decide to trade real money, all trading decision should be your own.