April 2, 2017
Welcome to Moses’s Singapore Stock Analysis @ AmiBrokerAcademy.com.
E5H Golden Agri Resources Was Sideways
Picture worth a thousand words. This chart was done on weekend, except was too busy to post on the site.
We said in the previous posting, unless you are in a hurry, otherwise just wait for another day (WOMD). The price is between thirty seven (37) cents and thirty eight point five (38.5) cents; sideways.
On the March 31, 2017 charting, we see higher low, if everything goes well. The trend will continue. It is likely to hit a higher high.
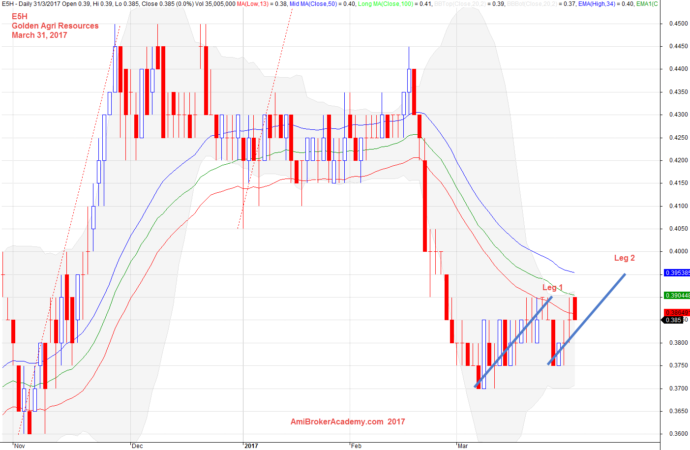
March 31, 2017 Golden Agri Resournces Daily with Two Legs Up
Moses
AmiBrokerAcademy.com
Disclaimer
The above result is for illustration purpose. It is not meant to be used for buy or sell decision. We do not recommend any particular stocks. If particular stocks of such are mentioned, they are meant as demonstration of Amibroker as a powerful charting software and MACD. Amibroker can program to scan the stocks for buy and sell signals.
These are script generated signals. Not all scan results are shown here. The MACD signal should use with price action. Users must understand what MACD and price action are all about before using them. If necessary you should attend a course to learn more on Technical Analysis (TA) and Moving Average Convergence Divergence, MACD.
Once again, the website does not guarantee any results or investment return based on the information and instruction you have read here. It should be used as learning aids only and if you decide to trade real money, all trading decision should be your own.