August 16, 2017
In addition to the last posting, see the analysis below.
HOG Harley Davidson and Gartley ABCD Chart Pattern
See chart for more, picture worth a thousand words.
It is easy to identify the ABCD chart pattern. See chart for more.
We see double top, so the trend reversed. Will the last ABCD chart pattern buy happen? Will see.
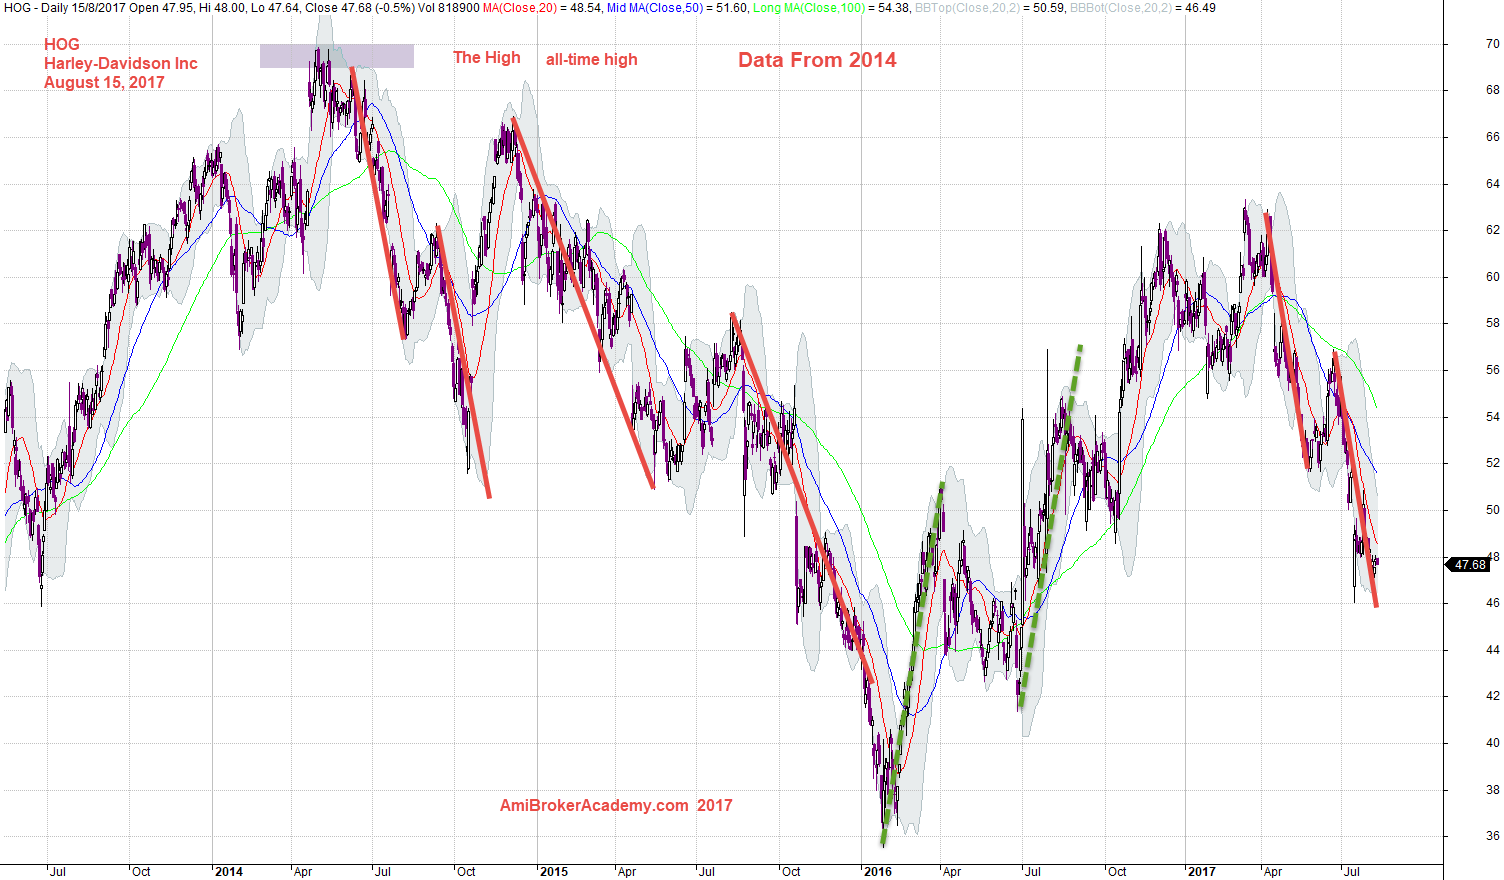
August 15, 2017 Harley Davidson and Gartley ABCD Chart Pattern
Thanks for visit the site here. You could also find free MACD scan here in this site too.
Moses
AmiBrokerAcademy.com
Disclaimer
The above result is for illustration purpose. It is not meant to be used for buy or sell decision. We do not recommend any particular stocks. If particular stocks of such are mentioned, they are meant as demonstration of Amibroker as a powerful charting software and MACD. Amibroker can program to scan the stocks for buy and sell signals.
These are script generated signals. Not all scan results are shown here. The MACD signal should use with price action. Users must understand what MACD and price action are all about before using them. If necessary you should attend a course to learn more on Technical Analysis (TA) and Moving Average Convergence Divergence, MACD.
Once again, the website does not guarantee any results or investment return based on the information and instruction you have read here. It should be used as learning aids only and if you decide to trade real money, all trading decision should be your own.