October 5, 2017
Yesterday was Mid-Autumn Festival
G07 Great Eastern Holdings and Inverted Head and Shoulders or Triple Bottoms
Picture worth a thousand words, see chart on inverted head and shoulders or triple bottoms.
Great Eastern Holdings share price may be shy away from 27 dollars.
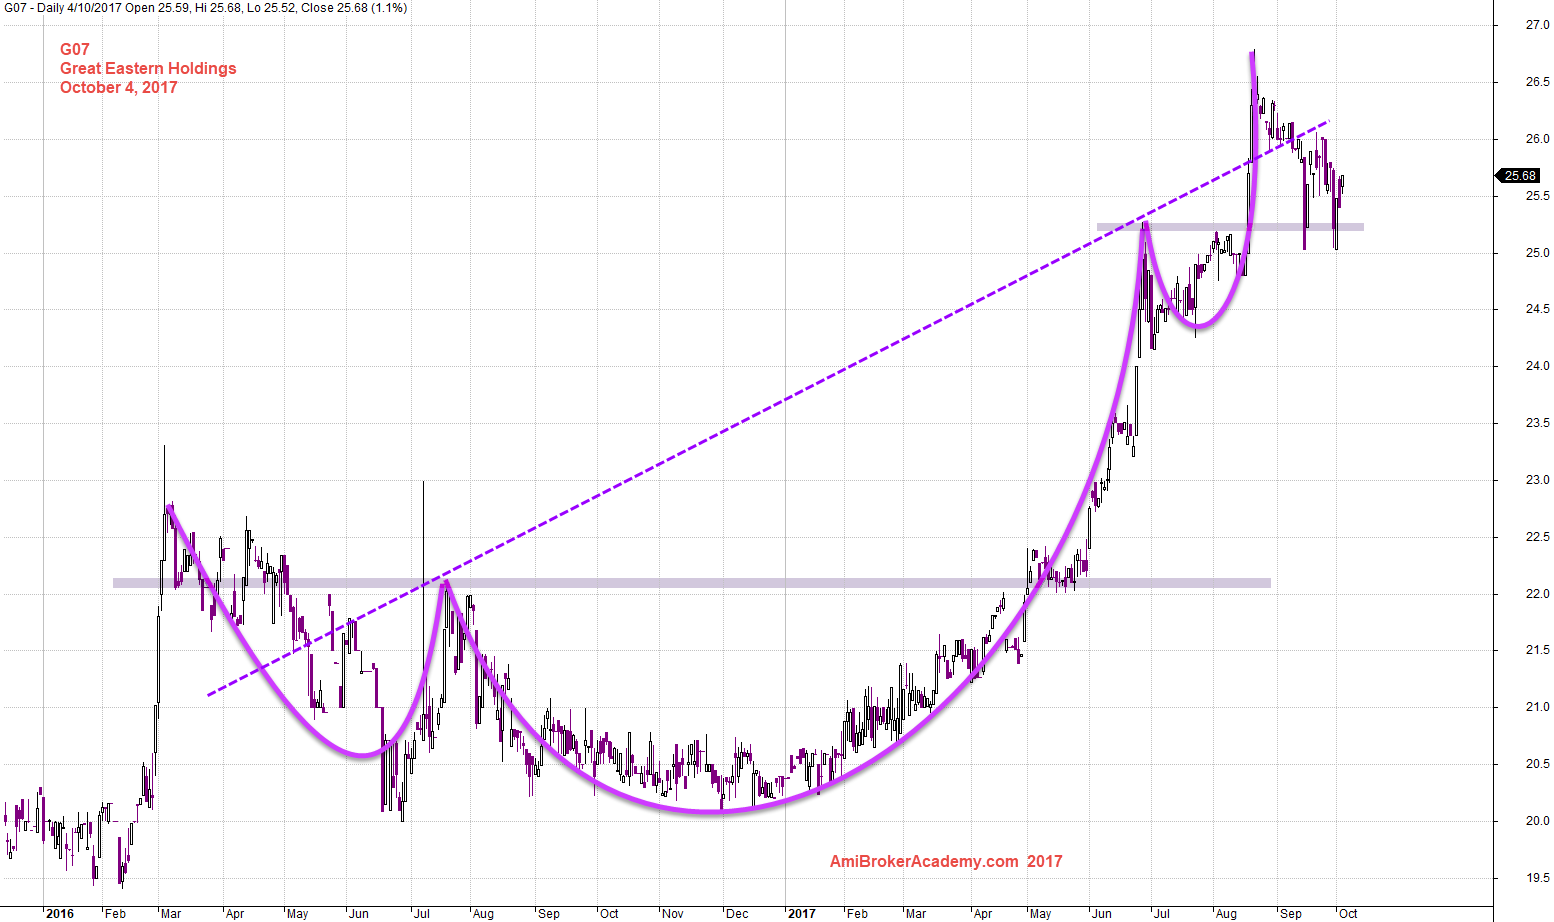
October 4, 2017 Great Eastern Holdings and Bottoms or Inverted Head and Shoulders
G07 Great Eastern Holdings and Support Resistance
Picture worth a thousand words, see chart.
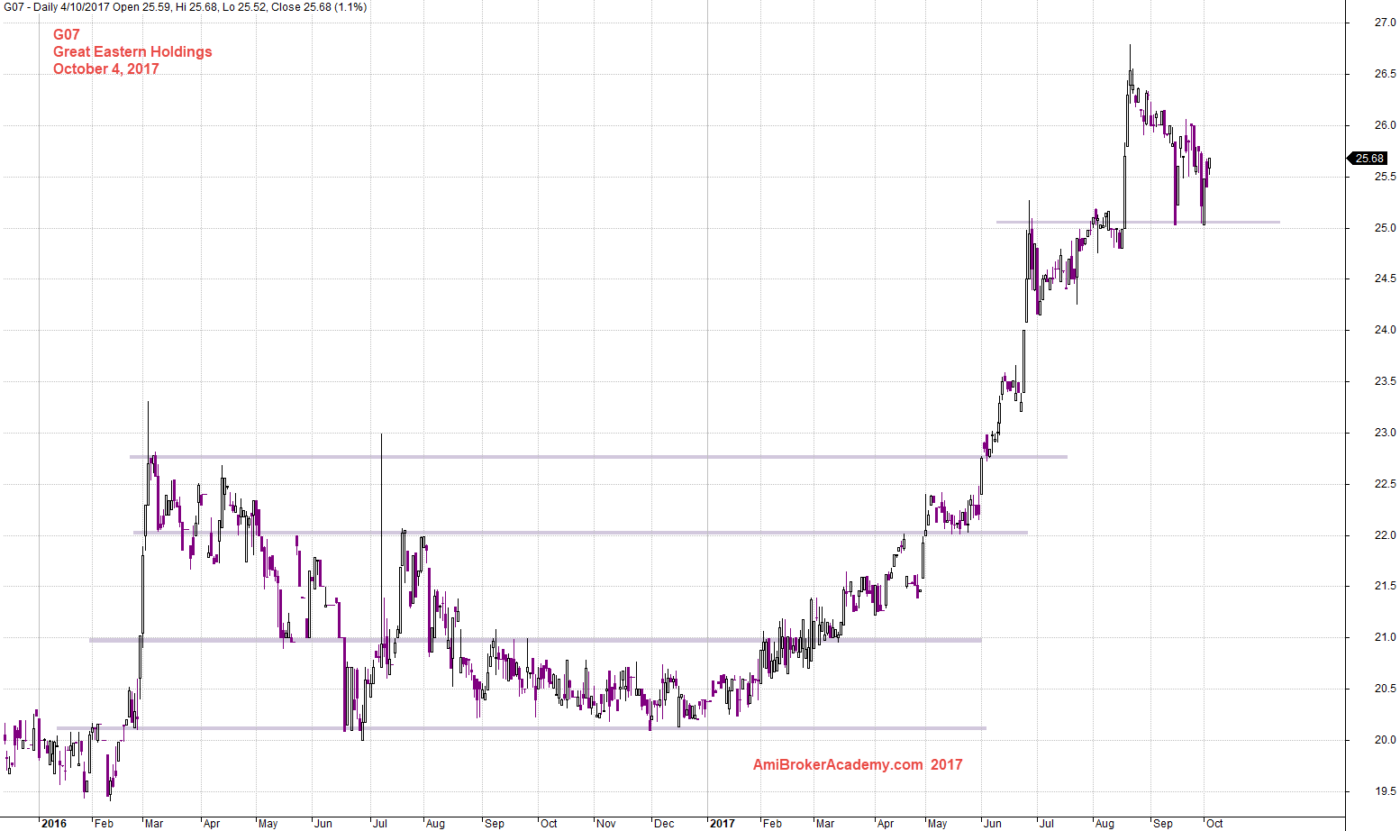
October 4, 2017 Great Eastern Holdings and Support Resistance
G07 Great Eastern Holdings and 34 MA Band
Picture worth a thousand words, see chart.
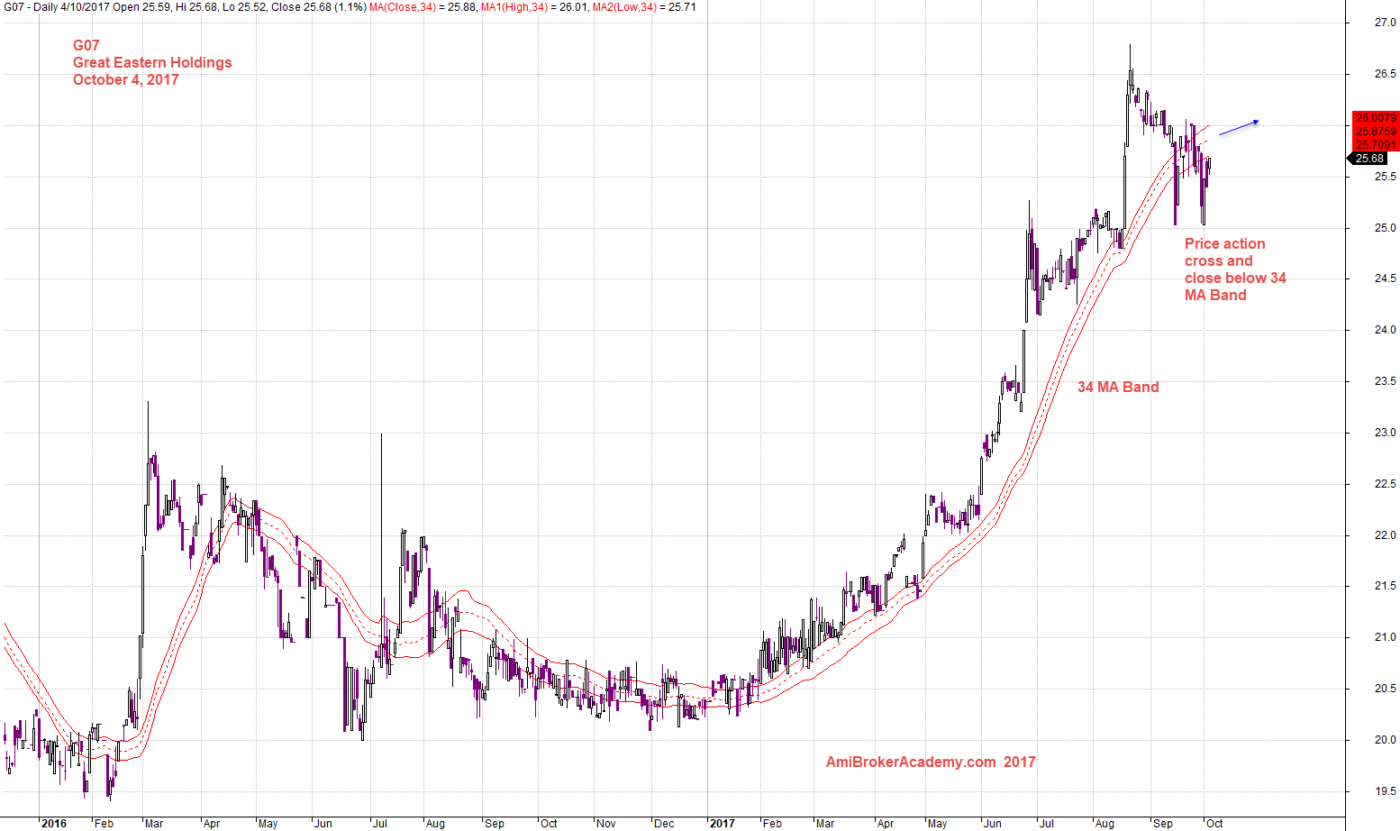
October 4, 2017 Great Eastern Holdings and 34 MA Band
G07 Great Eastern Holdings and 34 MA Band
Picture worth a thousand words, see chart.
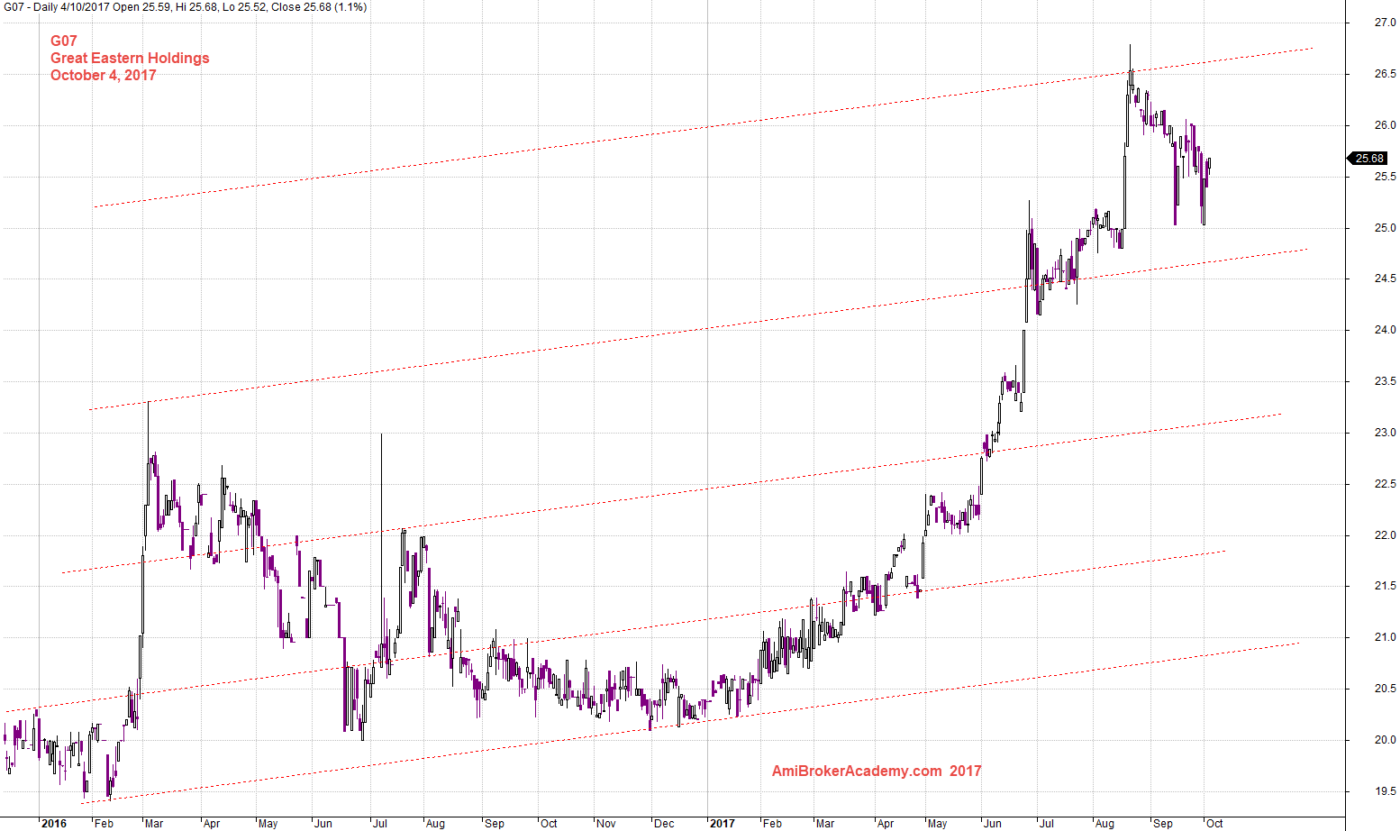
October 4, 2017 Great Eastern Holdings and Channel
Moses
AmiBrokerAcademy.com
Disclaimer
The above result is for illustration purpose. It is not meant to be used for buy or sell decision. We do not recommend any particular stocks. If particular stocks of such are mentioned, they are meant as demonstration of Amibroker as a powerful charting software and MACD. Amibroker can program to scan the stocks for buy and sell signals.
These are script generated signals. Not all scan results are shown here. The MACD signal should use with price action. Users must understand what MACD and price action are all about before using them. If necessary you should attend a course to learn more on Technical Analysis (TA) and Moving Average Convergence Divergence, MACD.
Once again, the website does not guarantee any results or investment return based on the information and instruction you have read here. It should be used as learning aids only and if you decide to trade real money, all trading decision should be your own.