March 22, 2017
Moses’ US Stock Review and MACD Stock Scan
Moses at AmiBrokerAcademy.com uses charting software AmiBorker’s AmiBroker AFL, to write an AmiBroker Formula Language program to scan through 6,300 stocks that stored in the data base for US Stocks, listed in AMEX, NASDAQ, and NYSE to find stocks have Moving Average Convergence Divergence (MACD) bullish and bearish signals.
March 15, 2017 Moses Free US Stock MACD Scan Results
Free stock market scan results, Moses’ Stock Corner. Moses provides a list of US stocks that have the following MACD signals.
- MACD line crosses above MACD signal – Bullish trend
- MACD line crosses above zero line – Bullish trend
- MACD Histogram +ve Divergence – Bullish trend
- MACD line crosses below MACD signal – Bearish trend
- MACD line crosses below zero line – Bearish trend
- MACD Histogram -ve Divergence – Bearish trend
- Volume traded greater 3,000,000 shares
Total 6300 stocks and only 25 MACD bullish and bearish signals with more than 3,000,000 shares. This stock screening narrow it to stocks to value between 51 dollars to 250 dollars.
Out of total of six stocks that have MACD signals, only three bull signal and three bear signal. This is from the scan of 6,229 stocks on our database.
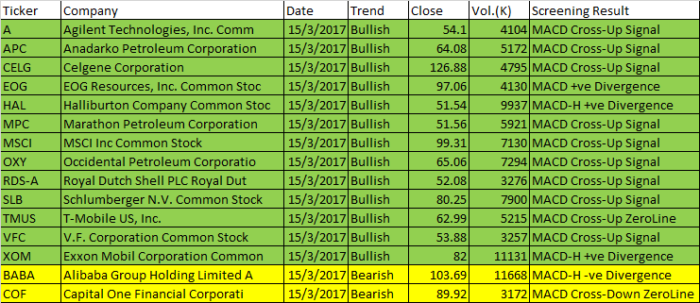
March 15, 2017 US Stock MACD Scan
| Ticker | Company | Date | Trend | Close | Vol.(K) | Screening Result |
| A | Agilent Technologies, Inc. Comm | 15/3/2017 | Bullish | 54.1 | 4104 | MACD Cross-Up Signal |
| APC | Anadarko Petroleum Corporation | 15/3/2017 | Bullish | 64.08 | 5172 | MACD Cross-Up Signal |
| CELG | Celgene Corporation | 15/3/2017 | Bullish | 126.88 | 4795 | MACD Cross-Up Signal |
| EOG | EOG Resources, Inc. Common Stoc | 15/3/2017 | Bullish | 97.06 | 4130 | MACD +ve Divergence |
| HAL | Halliburton Company Common Stoc | 15/3/2017 | Bullish | 51.54 | 9937 | MACD-H +ve Divergence |
| MPC | Marathon Petroleum Corporation | 15/3/2017 | Bullish | 51.56 | 5921 | MACD Cross-Up Signal |
| MSCI | MSCI Inc Common Stock | 15/3/2017 | Bullish | 99.31 | 7130 | MACD Cross-Up Signal |
| OXY | Occidental Petroleum Corporatio | 15/3/2017 | Bullish | 65.06 | 7294 | MACD Cross-Up Signal |
| RDS-A | Royal Dutch Shell PLC Royal Dut | 15/3/2017 | Bullish | 52.08 | 3276 | MACD Cross-Up Signal |
| SLB | Schlumberger N.V. Common Stock | 15/3/2017 | Bullish | 80.25 | 7900 | MACD Cross-Up Signal |
| TMUS | T-Mobile US, Inc. | 15/3/2017 | Bullish | 62.99 | 5215 | MACD Cross-Up ZeroLine |
| VFC | V.F. Corporation Common Stock | 15/3/2017 | Bullish | 53.88 | 3257 | MACD Cross-Up Signal |
| XOM | Exxon Mobil Corporation Common | 15/3/2017 | Bullish | 82 | 11131 | MACD-H +ve Divergence |
| BABA | Alibaba Group Holding Limited A | 15/3/2017 | Bearish | 103.69 | 11668 | MACD-H -ve Divergence |
| COF | Capital One Financial Corporati | 15/3/2017 | Bearish | 89.92 | 3172 | MACD Cross-Down ZeroLine |
Moses
AmiBrokerAcademy.com
Disclaimer
The above result is for illustration purpose. It is not meant to be used for buy or sell decision. We do not recommend any particular stocks. If particular stocks of such are mentioned, they are meant as demonstration of Amibroker as a powerful charting software and MACD. Amibroker can program to scan the stocks for buy and sell signals.
These are script generated signals. Not all scan results are shown here. The MACD signal should use with price action. Users must understand what MACD and price action are all about before using them. If necessary you should attend a course to learn more on Technical Analysis (TA) and Moving Average Convergence Divergence, MACD.
Once again, the website does not guarantee any results or investment return based on the information and instruction you have read here. It should be used as learning aids only and if you decide to trade real money, all trading decision should be your own.