February 3, 2018
Oscillator Moving Average Convergence Divergence
MACD is a popular trend following momentum indicator that shows the relationship of two moving averages of prices action; the MACD line and signal line.
Four MACD Signals:
- Crossovers – Sell Strategy, MACD crosses below the signal line. Buy Strategy, MACD rallies above the signal line. It is advisable to wait for confirmation to reduce possible whipsaw.
- Divergence – The security price action diverges from the MACD. It signals the end of the current trend.
- Cross Zero Line – MACD moves above or below zero line. Upward trend: Cross above zero line, short MA above long MA. Downward trend: Cross below zero line, short MA below long MA.
- Dramatic rise or fall – MACD rises or decline dramatically – when the shorter moving average pulls away from the longer-term moving average – Oversold or Overbought.
Free One-day US Stock MACD Screening Results for 2 February 2018
Remember all setup can fail. This is true for all indicators. It is also true for MACD signals setup. See some of the MACD setup fail examples on this website.
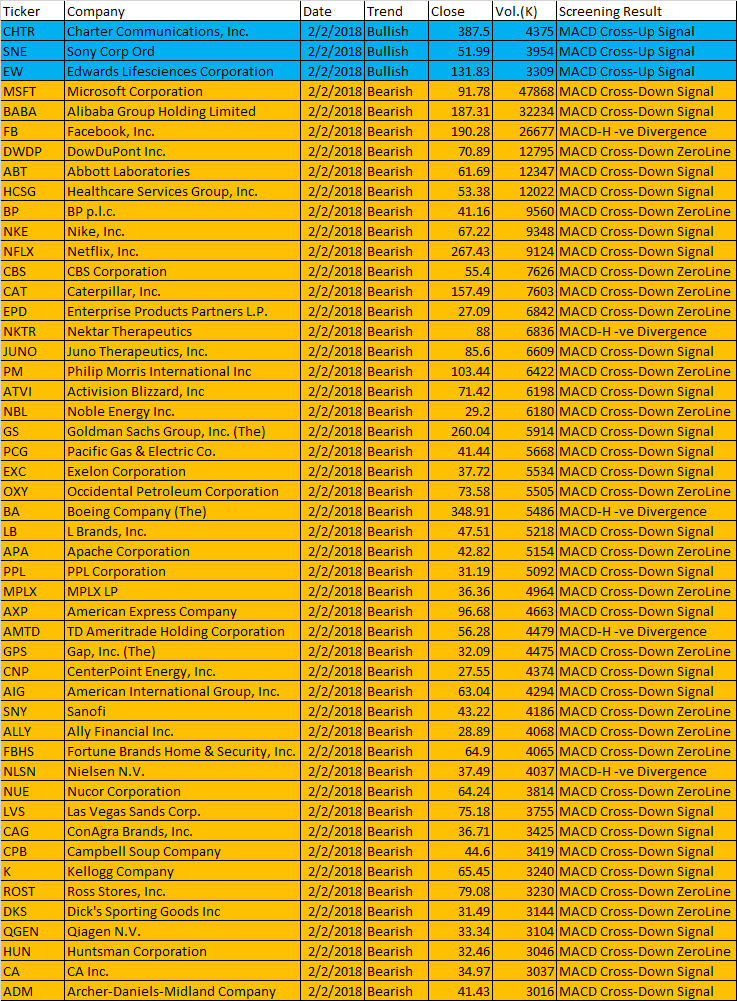
February 2, 2018 US Stock One-day MACD Scan Signals
- MACD line crosses above MACD signal – Bullish trend
- MACD line crosses above zero line – Bullish trend
- MACD Histogram +ve Divergence – Bullish trend
- MACD line crosses below MACD signal – Bearish trend
- MACD line crosses below zero line – Bearish trend
- MACD Histogram -ve Divergence – Bearish trend
| Ticker | Company | Date | Trend | Close | Vol.(K) | Screening Result |
| CHTR | Charter Communications, Inc. | 2/2/2018 | Bullish | 387.5 | 4375 | MACD Cross-Up Signal |
| SNE | Sony Corp Ord | 2/2/2018 | Bullish | 51.99 | 3954 | MACD Cross-Up Signal |
| EW | Edwards Lifesciences Corporation | 2/2/2018 | Bullish | 131.83 | 3309 | MACD Cross-Up Signal |
| MSFT | Microsoft Corporation | 2/2/2018 | Bearish | 91.78 | 47868 | MACD Cross-Down Signal |
| BABA | Alibaba Group Holding Limited | 2/2/2018 | Bearish | 187.31 | 32234 | MACD Cross-Down Signal |
| FB | Facebook, Inc. | 2/2/2018 | Bearish | 190.28 | 26677 | MACD-H -ve Divergence |
| DWDP | DowDuPont Inc. | 2/2/2018 | Bearish | 70.89 | 12795 | MACD Cross-Down ZeroLine |
| ABT | Abbott Laboratories | 2/2/2018 | Bearish | 61.69 | 12347 | MACD Cross-Down Signal |
| HCSG | Healthcare Services Group, Inc. | 2/2/2018 | Bearish | 53.38 | 12022 | MACD Cross-Down Signal |
| BP | BP p.l.c. | 2/2/2018 | Bearish | 41.16 | 9560 | MACD Cross-Down ZeroLine |
| NKE | Nike, Inc. | 2/2/2018 | Bearish | 67.22 | 9348 | MACD Cross-Down Signal |
| NFLX | Netflix, Inc. | 2/2/2018 | Bearish | 267.43 | 9124 | MACD Cross-Down Signal |
| CBS | CBS Corporation | 2/2/2018 | Bearish | 55.4 | 7626 | MACD Cross-Down ZeroLine |
| CAT | Caterpillar, Inc. | 2/2/2018 | Bearish | 157.49 | 7603 | MACD Cross-Down ZeroLine |
| EPD | Enterprise Products Partners L.P. | 2/2/2018 | Bearish | 27.09 | 6842 | MACD Cross-Down ZeroLine |
| NKTR | Nektar Therapeutics | 2/2/2018 | Bearish | 88 | 6836 | MACD-H -ve Divergence |
| JUNO | Juno Therapeutics, Inc. | 2/2/2018 | Bearish | 85.6 | 6609 | MACD Cross-Down Signal |
| PM | Philip Morris International Inc | 2/2/2018 | Bearish | 103.44 | 6422 | MACD Cross-Down ZeroLine |
| ATVI | Activision Blizzard, Inc | 2/2/2018 | Bearish | 71.42 | 6198 | MACD Cross-Down Signal |
| NBL | Noble Energy Inc. | 2/2/2018 | Bearish | 29.2 | 6180 | MACD Cross-Down ZeroLine |
| GS | Goldman Sachs Group, Inc. (The) | 2/2/2018 | Bearish | 260.04 | 5914 | MACD Cross-Down Signal |
| PCG | Pacific Gas & Electric Co. | 2/2/2018 | Bearish | 41.44 | 5668 | MACD Cross-Down Signal |
| EXC | Exelon Corporation | 2/2/2018 | Bearish | 37.72 | 5534 | MACD Cross-Down Signal |
| OXY | Occidental Petroleum Corporation | 2/2/2018 | Bearish | 73.58 | 5505 | MACD Cross-Down ZeroLine |
| BA | Boeing Company (The) | 2/2/2018 | Bearish | 348.91 | 5486 | MACD-H -ve Divergence |
| LB | L Brands, Inc. | 2/2/2018 | Bearish | 47.51 | 5218 | MACD Cross-Down Signal |
| APA | Apache Corporation | 2/2/2018 | Bearish | 42.82 | 5154 | MACD Cross-Down ZeroLine |
| PPL | PPL Corporation | 2/2/2018 | Bearish | 31.19 | 5092 | MACD Cross-Down Signal |
| MPLX | MPLX LP | 2/2/2018 | Bearish | 36.36 | 4964 | MACD Cross-Down ZeroLine |
| AXP | American Express Company | 2/2/2018 | Bearish | 96.68 | 4663 | MACD Cross-Down Signal |
| AMTD | TD Ameritrade Holding Corporation | 2/2/2018 | Bearish | 56.28 | 4479 | MACD-H -ve Divergence |
| GPS | Gap, Inc. (The) | 2/2/2018 | Bearish | 32.09 | 4475 | MACD Cross-Down ZeroLine |
| CNP | CenterPoint Energy, Inc. | 2/2/2018 | Bearish | 27.55 | 4374 | MACD Cross-Down Signal |
| AIG | American International Group, Inc. | 2/2/2018 | Bearish | 63.04 | 4294 | MACD Cross-Down Signal |
| SNY | Sanofi | 2/2/2018 | Bearish | 43.22 | 4186 | MACD Cross-Down ZeroLine |
| ALLY | Ally Financial Inc. | 2/2/2018 | Bearish | 28.89 | 4068 | MACD Cross-Down ZeroLine |
| FBHS | Fortune Brands Home & Security, Inc. | 2/2/2018 | Bearish | 64.9 | 4065 | MACD Cross-Down ZeroLine |
| NLSN | Nielsen N.V. | 2/2/2018 | Bearish | 37.49 | 4037 | MACD-H -ve Divergence |
| NUE | Nucor Corporation | 2/2/2018 | Bearish | 64.24 | 3814 | MACD Cross-Down ZeroLine |
| LVS | Las Vegas Sands Corp. | 2/2/2018 | Bearish | 75.18 | 3755 | MACD Cross-Down Signal |
| CAG | ConAgra Brands, Inc. | 2/2/2018 | Bearish | 36.71 | 3425 | MACD Cross-Down Signal |
| CPB | Campbell Soup Company | 2/2/2018 | Bearish | 44.6 | 3419 | MACD Cross-Down Signal |
| K | Kellogg Company | 2/2/2018 | Bearish | 65.45 | 3240 | MACD Cross-Down Signal |
| ROST | Ross Stores, Inc. | 2/2/2018 | Bearish | 79.08 | 3230 | MACD Cross-Down ZeroLine |
| DKS | Dick’s Sporting Goods Inc | 2/2/2018 | Bearish | 31.49 | 3144 | MACD Cross-Down ZeroLine |
| QGEN | Qiagen N.V. | 2/2/2018 | Bearish | 33.34 | 3104 | MACD Cross-Down Signal |
| HUN | Huntsman Corporation | 2/2/2018 | Bearish | 32.46 | 3046 | MACD Cross-Down ZeroLine |
| CA | CA Inc. | 2/2/2018 | Bearish | 34.97 | 3037 | MACD Cross-Down Signal |
| ADM | Archer-Daniels-Midland Company | 2/2/2018 | Bearish | 41.43 | 3016 | MACD Cross-Down Signal |
Have fun!Users must understand what MACD is all about before using the results.
Moses Singapore Stock MACD Screening Signals
AmiBroker Academy.com
Disclaimer:
The above result is for illustration purpose. It is not meant to be used for buy or sell decision. We do not recommend any particular stocks. If particular stocks of such are mentioned, they are meant as demonstration of Amibroker as a powerful charting software and MACD. Amibroker can program to scan the stocks for buy and sell signals.
These are script generated signals. Not all scan results are shown here. The MACD signal should use with price action. Users must understand what MACD and price action are all about before using them. If necessary you should attend a course to learn more on Technical Analysis (TA) and Moving Average Convergence Divergence, MACD.
Once again, the website does not guarantee any results or investment return based on the information and instruction you have read here. It should be used as learning aids only and if you decide to trade real money, all trading decision should be your own.