February 22, 2018
Today is the seventh day of CNY, this is everyone birthday. Most of the people whom celebrate CNY will probably get together to have a dinner and wishing all are well for the entire Dog year (戊戌年), be wealthy, healthy and happy.
You too, you have a wealthy, healthy and happy 戊戌年. Happy Birthday.
Oscillator Moving Average Convergence Divergence
MACD is a popular trend following momentum indicator that shows the relationship of two moving averages of prices action; the MACD line and signal line.
Four MACD Signals:
- Crossovers – Sell Strategy, MACD crosses below the signal line. Buy Strategy, MACD rallies above the signal line. It is advisable to wait for confirmation to reduce possible whipsaw.
- Divergence – The security price action diverges from the MACD. It signals the end of the current trend.
- Cross Zero Line – MACD moves above or below zero line. Upward trend: Cross above zero line, short MA above long MA. Downward trend: Cross below zero line, short MA below long MA.
- Dramatic rise or fall – MACD rises or decline dramatically – when the shorter moving average pulls away from the longer-term moving average – Oversold or Overbought.
Free One-day US Stock MACD Screening Results for 21 February 2018
Remember all setup can fail. This is true for all indicators. It is also true for MACD signals setup. See some of the MACD setup fail examples on this website.
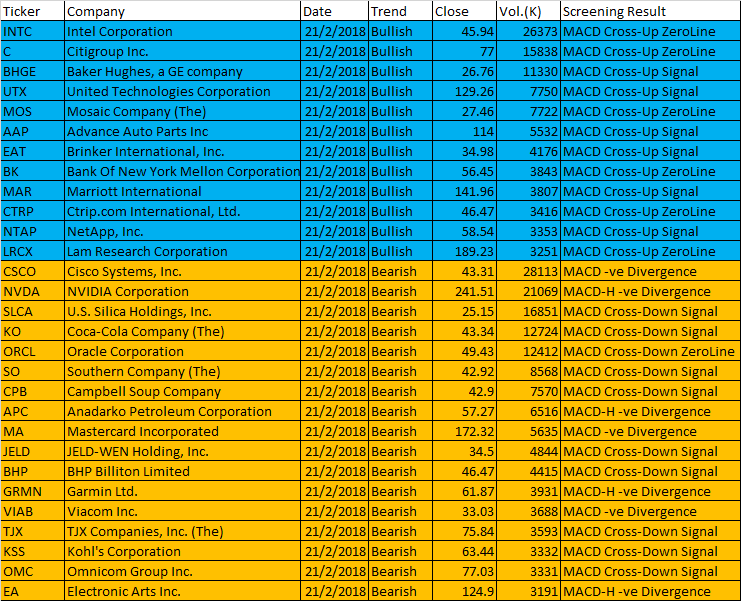
20180221 US Stock One-day MACD Screening Signals
- MACD line crosses above MACD signal – Bullish trend
- MACD line crosses above zero line – Bullish trend
- MACD Histogram +ve Divergence – Bullish trend
- MACD line crosses below MACD signal – Bearish trend
- MACD line crosses below zero line – Bearish trend
- MACD Histogram -ve Divergence – Bearish trend
| Ticker | Company | Date | Trend | Close | Vol.(K) | Screening Result |
| INTC | Intel Corporation | 21/2/2018 | Bullish | 45.94 | 26373 | MACD Cross-Up ZeroLine |
| C | Citigroup Inc. | 21/2/2018 | Bullish | 77 | 15838 | MACD Cross-Up ZeroLine |
| BHGE | Baker Hughes, a GE company | 21/2/2018 | Bullish | 26.76 | 11330 | MACD Cross-Up Signal |
| UTX | United Technologies Corporation | 21/2/2018 | Bullish | 129.26 | 7750 | MACD Cross-Up Signal |
| MOS | Mosaic Company (The) | 21/2/2018 | Bullish | 27.46 | 7722 | MACD Cross-Up ZeroLine |
| AAP | Advance Auto Parts Inc | 21/2/2018 | Bullish | 114 | 5532 | MACD Cross-Up Signal |
| EAT | Brinker International, Inc. | 21/2/2018 | Bullish | 34.98 | 4176 | MACD Cross-Up Signal |
| BK | Bank Of New York Mellon Corporation (The) | 21/2/2018 | Bullish | 56.45 | 3843 | MACD Cross-Up ZeroLine |
| MAR | Marriott International | 21/2/2018 | Bullish | 141.96 | 3807 | MACD Cross-Up Signal |
| CTRP | Ctrip.com International, Ltd. | 21/2/2018 | Bullish | 46.47 | 3416 | MACD Cross-Up ZeroLine |
| NTAP | NetApp, Inc. | 21/2/2018 | Bullish | 58.54 | 3353 | MACD Cross-Up Signal |
| LRCX | Lam Research Corporation | 21/2/2018 | Bullish | 189.23 | 3251 | MACD Cross-Up ZeroLine |
| CSCO | Cisco Systems, Inc. | 21/2/2018 | Bearish | 43.31 | 28113 | MACD -ve Divergence |
| NVDA | NVIDIA Corporation | 21/2/2018 | Bearish | 241.51 | 21069 | MACD-H -ve Divergence |
| SLCA | U.S. Silica Holdings, Inc. | 21/2/2018 | Bearish | 25.15 | 16851 | MACD Cross-Down Signal |
| KO | Coca-Cola Company (The) | 21/2/2018 | Bearish | 43.34 | 12724 | MACD Cross-Down Signal |
| ORCL | Oracle Corporation | 21/2/2018 | Bearish | 49.43 | 12412 | MACD Cross-Down ZeroLine |
| SO | Southern Company (The) | 21/2/2018 | Bearish | 42.92 | 8568 | MACD Cross-Down Signal |
| CPB | Campbell Soup Company | 21/2/2018 | Bearish | 42.9 | 7570 | MACD Cross-Down Signal |
| APC | Anadarko Petroleum Corporation | 21/2/2018 | Bearish | 57.27 | 6516 | MACD-H -ve Divergence |
| MA | Mastercard Incorporated | 21/2/2018 | Bearish | 172.32 | 5635 | MACD -ve Divergence |
| JELD | JELD-WEN Holding, Inc. | 21/2/2018 | Bearish | 34.5 | 4844 | MACD Cross-Down Signal |
| BHP | BHP Billiton Limited | 21/2/2018 | Bearish | 46.47 | 4415 | MACD Cross-Down Signal |
| GRMN | Garmin Ltd. | 21/2/2018 | Bearish | 61.87 | 3931 | MACD-H -ve Divergence |
| VIAB | Viacom Inc. | 21/2/2018 | Bearish | 33.03 | 3688 | MACD -ve Divergence |
| TJX | TJX Companies, Inc. (The) | 21/2/2018 | Bearish | 75.84 | 3593 | MACD Cross-Down Signal |
| KSS | Kohl’s Corporation | 21/2/2018 | Bearish | 63.44 | 3332 | MACD Cross-Down Signal |
| OMC | Omnicom Group Inc. | 21/2/2018 | Bearish | 77.03 | 3331 | MACD Cross-Down Signal |
| EA | Electronic Arts Inc. | 21/2/2018 | Bearish | 124.9 | 3191 | MACD-H -ve Divergence |
Have fun!Users must understand what MACD is all about before using the results.
Moses US Stock MACD Screening Signals
AmiBroker Academy.com
Disclaimer:
The above result is for illustration purpose. It is not meant to be used for buy or sell decision. We do not recommend any particular stocks. If particular stocks of such are mentioned, they are meant as demonstration of Amibroker as a powerful charting software and MACD. Amibroker can program to scan the stocks for buy and sell signals.
These are script generated signals. Not all scan results are shown here. The MACD signal should use with price action. Users must understand what MACD and price action are all about before using them. If necessary you should attend a course to learn more on Technical Analysis (TA) and Moving Average Convergence Divergence, MACD.
Once again, the website does not guarantee any results or investment return based on the information and instruction you have read here. It should be used as learning aids only and if you decide to trade real money, all trading decision should be your own.