November 7, 2017
Last Week Singapore Stock MACD Scan Results for 30 October to 3 November 2017
Remember all setup can fail. This is true for all indicators. It is also true for MACD signals setup.
October 30 to November 3, 2017 Singapore Five-day MACD Signals
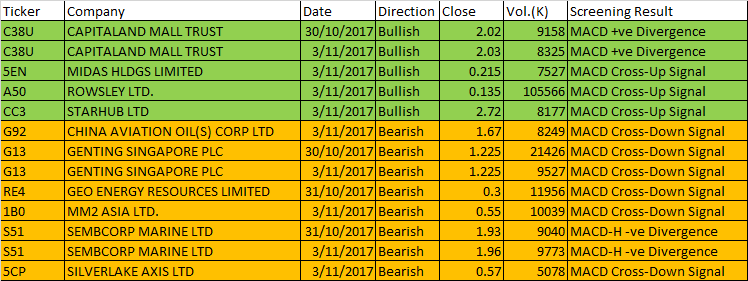
The Following is Weekly October 30 to November 3, 2017 Singapore Stock MACD Scan Results
The following are script generated signals using the Powerful AmiBroker AFL. AmiBroker is a powerful charting software. The results here are not meant to be used for buy or sell decisions. We do not vouch for their accuracy; depending of the author trading rules. They are meant to demonstrate the powerful Amibroker charting software functionality.
NOT all scan results are shown here.
| Ticker | Company | Date | Direction | Close | Vol.(K) | Screening Result |
| C38U | CAPITALAND MALL TRUST | 30/10/2017 | Bullish | 2.02 | 9158 | MACD +ve Divergence |
| C38U | CAPITALAND MALL TRUST | 3/11/2017 | Bullish | 2.03 | 8325 | MACD +ve Divergence |
| 5EN | MIDAS HLDGS LIMITED | 3/11/2017 | Bullish | 0.215 | 7527 | MACD Cross-Up Signal |
| A50 | ROWSLEY LTD. | 3/11/2017 | Bullish | 0.135 | 105566 | MACD Cross-Up Signal |
| CC3 | STARHUB LTD | 3/11/2017 | Bullish | 2.72 | 8177 | MACD Cross-Up Signal |
| G92 | CHINA AVIATION OIL(S) CORP LTD | 3/11/2017 | Bearish | 1.67 | 8249 | MACD Cross-Down Signal |
| G13 | GENTING SINGAPORE PLC | 30/10/2017 | Bearish | 1.225 | 21426 | MACD Cross-Down Signal |
| G13 | GENTING SINGAPORE PLC | 3/11/2017 | Bearish | 1.225 | 9527 | MACD Cross-Down Signal |
| RE4 | GEO ENERGY RESOURCES LIMITED | 31/10/2017 | Bearish | 0.3 | 11956 | MACD Cross-Down Signal |
| 1B0 | MM2 ASIA LTD. | 3/11/2017 | Bearish | 0.55 | 10039 | MACD Cross-Down Signal |
| S51 | SEMBCORP MARINE LTD | 31/10/2017 | Bearish | 1.93 | 9040 | MACD-H -ve Divergence |
| S51 | SEMBCORP MARINE LTD | 3/11/2017 | Bearish | 1.96 | 9773 | MACD-H -ve Divergence |
| 5CP | SILVERLAKE AXIS LTD | 3/11/2017 | Bearish | 0.57 | 5078 | MACD Cross-Down Signal |
Note:
Users must understand what MACD is all about before using the results.
Have fun!
Moses Singapore Stock MACD Scan
AmiBroker Academy.com
Disclaimer:
The above result is for illustration purpose. It is not meant to be used for buy or sell decision. We do not recommend any particular stocks. If particular stocks of such are mentioned, they are meant as demonstration of Amibroker as a powerful charting software and MACD. Amibroker can program to scan the stocks for buy and sell signals.
These are script generated signals. Not all scan results are shown here. The MACD signal should use with price action. Users must understand what MACD and price action are all about before using them. If necessary you should attend a course to learn more on Technical Analysis (TA) and Moving Average Convergence Divergence, MACD.
Once again, the website does not guarantee any results or investment return based on the information and instruction you have read here. It should be used as learning aids only and if you decide to trade real money, all trading decision should be your own.