May 10, 2017
Five days US Stocks MACD signals. Free US Stock MACD Scan for Trading Day Close May 1 to 5, 2017
Welcome to Moses’s Stock Scan at AmiBrokerAcademy.com.
The following are US stocks five-day MACD screening using Amibroker script . These stocks screening script narrow the selection to stocks between the value of fifty one dollars to one thousand dollars with at least 5,000,000 shares changed hands.
Why Using Script to Screen Stocks?
To narrow down to only a few stocks for your limited capital and ensure the stocks might move in the short term.
We Look For the following Four MACD Signals:
- Crossovers – Sell Strategy, MACD crosses below the signal line. Buy Strategy, MACD rallies above the signal line. It is advisable to wait for confirmation to reduce possible whipsaw.
- Divergence – The security price action diverges from the MACD. It signals the end of the current trend.
- Cross Zero Line – MACD moves above or below zero line. Upward trend: Cross above zero line, short MA above long MA. Downward trend: Cross below zero line, short MA below long MA.
- Dramatic rise or fall – MACD rises or decline dramatically – when the shorter moving average pulls away from the longer-term moving average – Oversold or Overbought.
We vary the selection criteria, ie narrow down to 5,000,000 stocks changed hands.
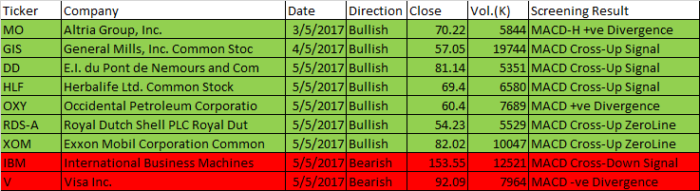
May 1 to 5, 2017 US Stock MACD Scan
| Ticker | Company | Date | Direction | Close | Vol.(K) | Screening Result |
| MO | Altria Group, Inc. | 3/5/2017 | Bullish | 70.22 | 5844 | MACD-H +ve Divergence |
| GIS | General Mills, Inc. Common Stoc | 4/5/2017 | Bullish | 57.05 | 19744 | MACD Cross-Up Signal |
| DD | E.I. du Pont de Nemours and Com | 5/5/2017 | Bullish | 81.14 | 5351 | MACD Cross-Up Signal |
| HLF | Herbalife Ltd. Common Stock | 5/5/2017 | Bullish | 69.4 | 6580 | MACD Cross-Up Signal |
| OXY | Occidental Petroleum Corporatio | 5/5/2017 | Bullish | 60.4 | 7689 | MACD +ve Divergence |
| RDS-A | Royal Dutch Shell PLC Royal Dut | 5/5/2017 | Bullish | 54.23 | 5529 | MACD Cross-Up ZeroLine |
| XOM | Exxon Mobil Corporation Common | 5/5/2017 | Bullish | 82.02 | 10047 | MACD Cross-Up ZeroLine |
| IBM | International Business Machines | 5/5/2017 | Bearish | 153.55 | 12521 | MACD Cross-Down Signal |
| V | Visa Inc. | 5/5/2017 | Bearish | 92.09 | 7964 | MACD -ve Divergence |
Moses
AmiBrokerAcademy.com
Disclaimer
The above result is for illustration purpose. It is not meant to be used for buy or sell decision. We do not recommend any particular stocks. If particular stocks of such are mentioned, they are meant as demonstration of Amibroker as a powerful charting software and MACD. Amibroker can program to scan the stocks for buy and sell signals.
These are script generated signals. Not all scan results are shown here. The MACD signal should use with price action. Users must understand what MACD and price action are all about before using them. If necessary you should attend a course to learn more on Technical Analysis (TA) and Moving Average Convergence Divergence, MACD.
Once again, the website does not guarantee any results or investment return based on the information and instruction you have read here. It should be used as learning aids only and if you decide to trade real money, all trading decision should be your own.