October 8, 2017
EB5 First Resources and Levels
See chart, picture worth a thousand words, the chart says it all. See the power of the support resistance. The price after test $2.05 and start to decline. Price was approaching $1.70, but the price action bounce off just before that. Now the price is trapped between $2 and $1.7.
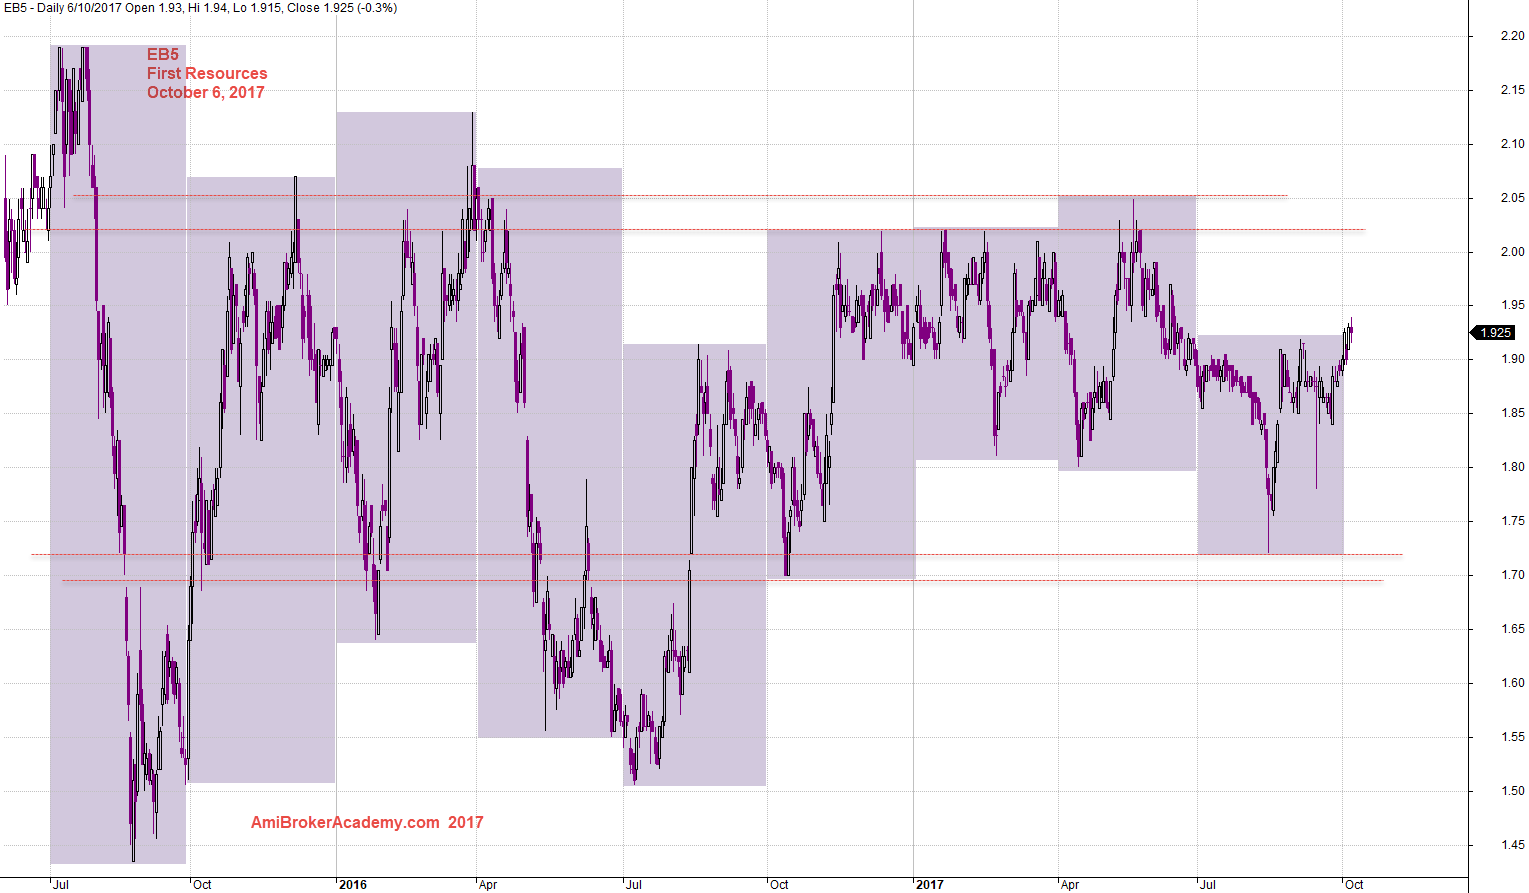
October 6, 2017 First Resources and Levels
EB5 First Resources and MACD Divergence
See chart, picture worth a thousand words, the chart says it all. Price is forming lower low and the MACD Histogram is forming higher low.
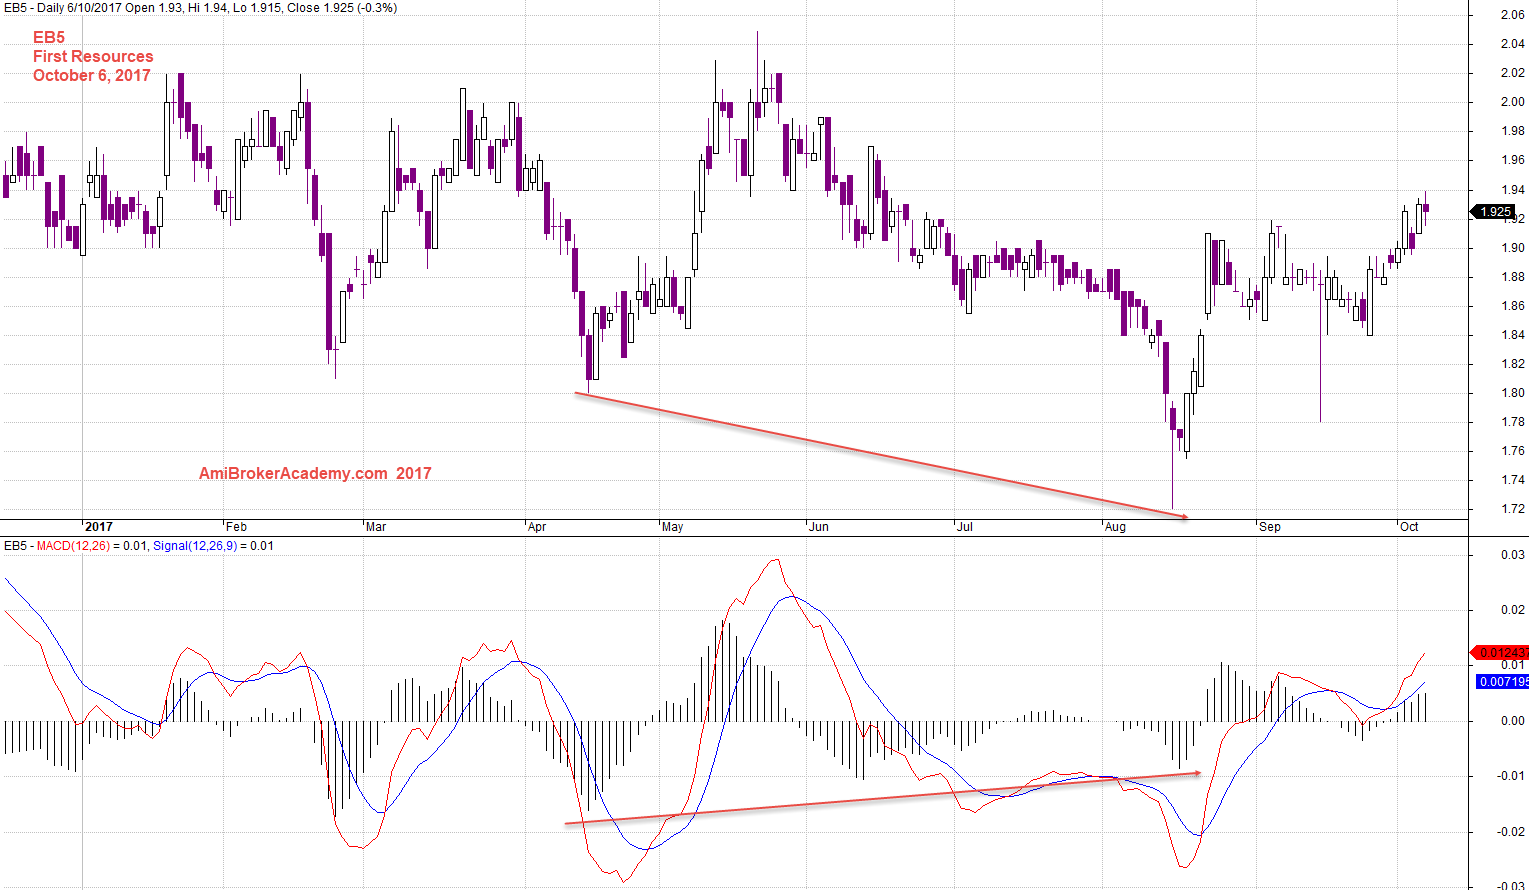
October 6, 2017 First Resources and MACD Divergence
First Resources EB5 and 34 MA Band
Picture worth a thousand words, see chart, if you take the MA band as a guide it may reduce some of your risk. But remember always, all setup can fail. So, wait is a great strategy, next confirmation is also can not over look.
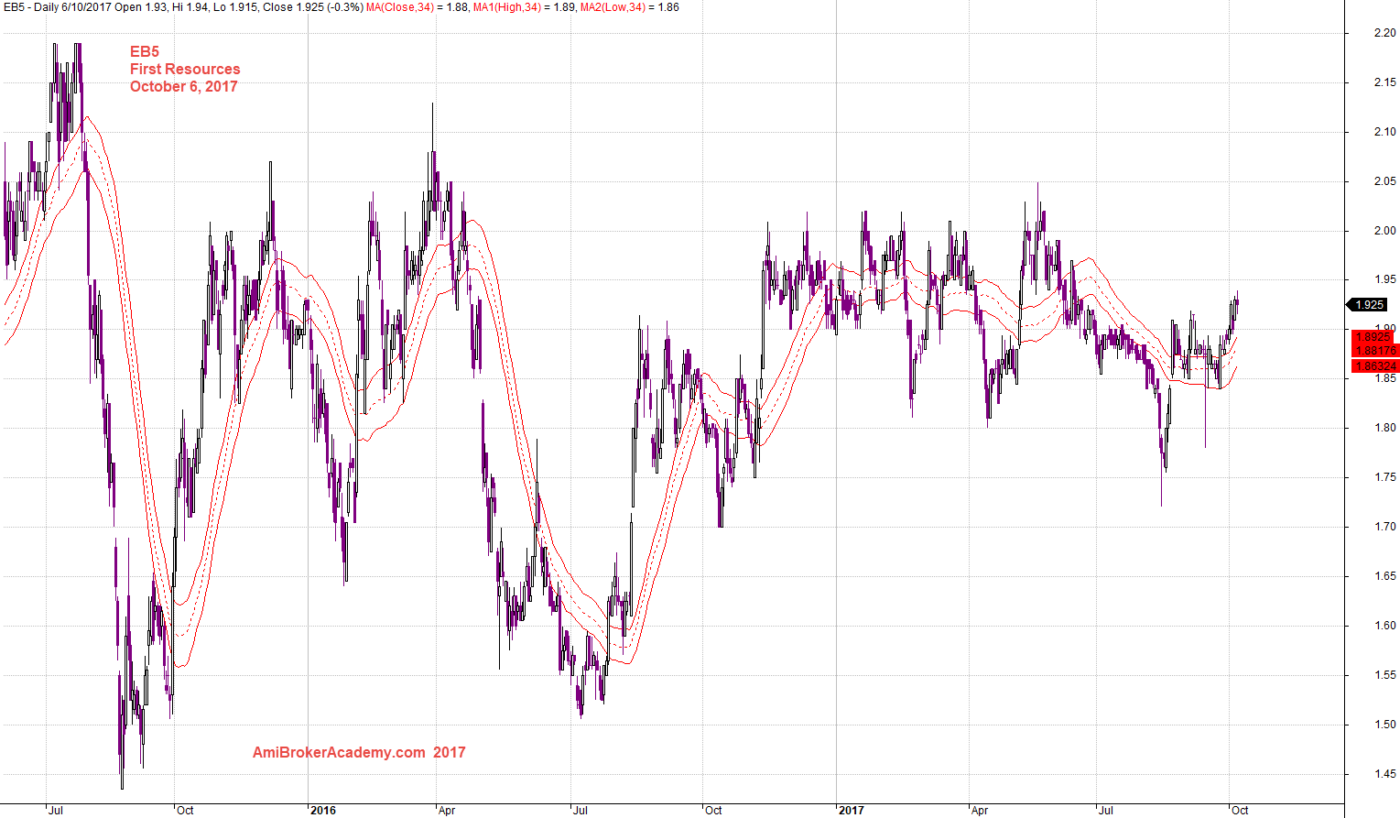
October 6, 2017 First Resources and 34 MA Band
Moses
AmiBrokerAcademy.com
Disclaimer
The above result is for illustration purpose. It is not meant to be used for buy or sell decision. We do not recommend any particular stocks. If particular stocks of such are mentioned, they are meant as demonstration of Amibroker as a powerful charting software and MACD. Amibroker can program to scan the stocks for buy and sell signals.
These are script generated signals. Not all scan results are shown here. The MACD signal should use with price action. Users must understand what MACD and price action are all about before using them. If necessary you should attend a course to learn more on Technical Analysis (TA) and Moving Average Convergence Divergence, MACD.
Once again, the website does not guarantee any results or investment return based on the information and instruction you have read here. It should be used as learning aids only and if you decide to trade real money, all trading decision should be your own.