22 September 2016
F34 Wilmar International Stock Analysis
ABCD chart pattern is a very powerful measure on where may price ended. Picture worth a thousand words, my analysis, wait for the price to pullback test the brown line before go long.
The price action is bearish generally. The trend is continued to form the lower low and lower high.
Pay attention to moving average. We said earlier the price action is bearish, as the price action cross below MAs and stay below. Next we see all MAs are coming together. What’s next? Ranging, then spike up or spike down. All are possible.
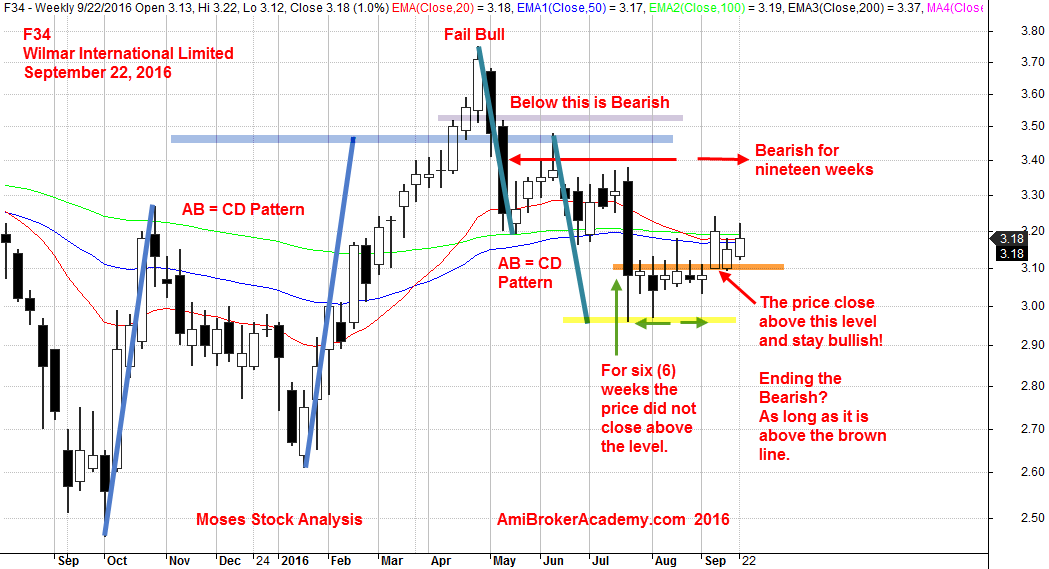
22 September 2016 Wilmar International Limited Weekly Chart
Have Fun!
Moses Singapore Stock Analysis
AmiBrokerAcademy.com
Disclaimer: All information, data and material contained, presented, or provided on amibrokeracademy.com is for educational purposes only. It is not to be construed or intended as providing trading or legal advice. Decisions you make about your trading or investment are important to you and your family, therefore should be made in consultation with a competent financial advisor or professional. We are not financial advisor and do not claim to be. Any views expressed here-in are not necessarily those held by amibrokeracademy.com. You are responsible for your trade decision and wealth being.