February 18, 2018
As Said This is Extra Hot and Spicy Year
How BABA stock performed in this last ten days? The recent market are not meant for the weak heart traders.
US Stock Analysis
BABA Alibaba Group Holding and Fibonacci 61.8% Retracement
See chart for more, swing low from August Low, the price action retrace down to 61.8% but the price action did not close below 61.8%. It is likely the price action become bullish after.
Manage your risk!
Powerful Chart Software – AmiBroker
The following chart is produced using AmiBroker charting software. It is a powerful chart software. You plot the stocks you are interested all in one chart, as long as you still could read them. See chart below.
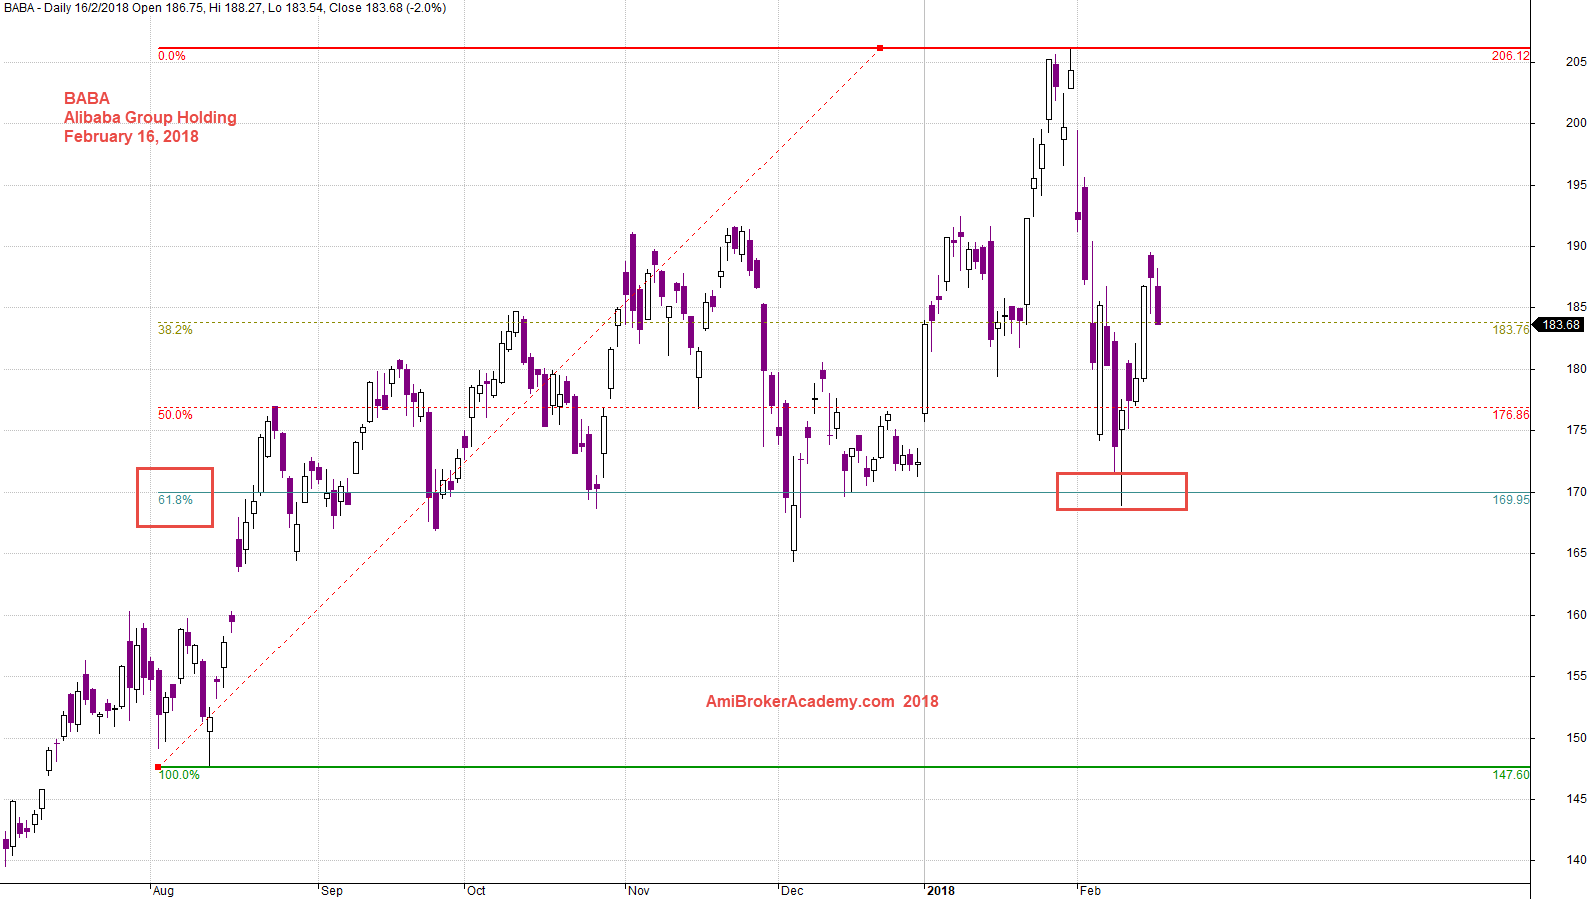
20180216 Alibaba Group Holding and 61.8% Fibonacci Retracement
BABA and MACD Indicator
See chart for more. The MACD did not really cross up signal, the MACD Cross Signal Fail.
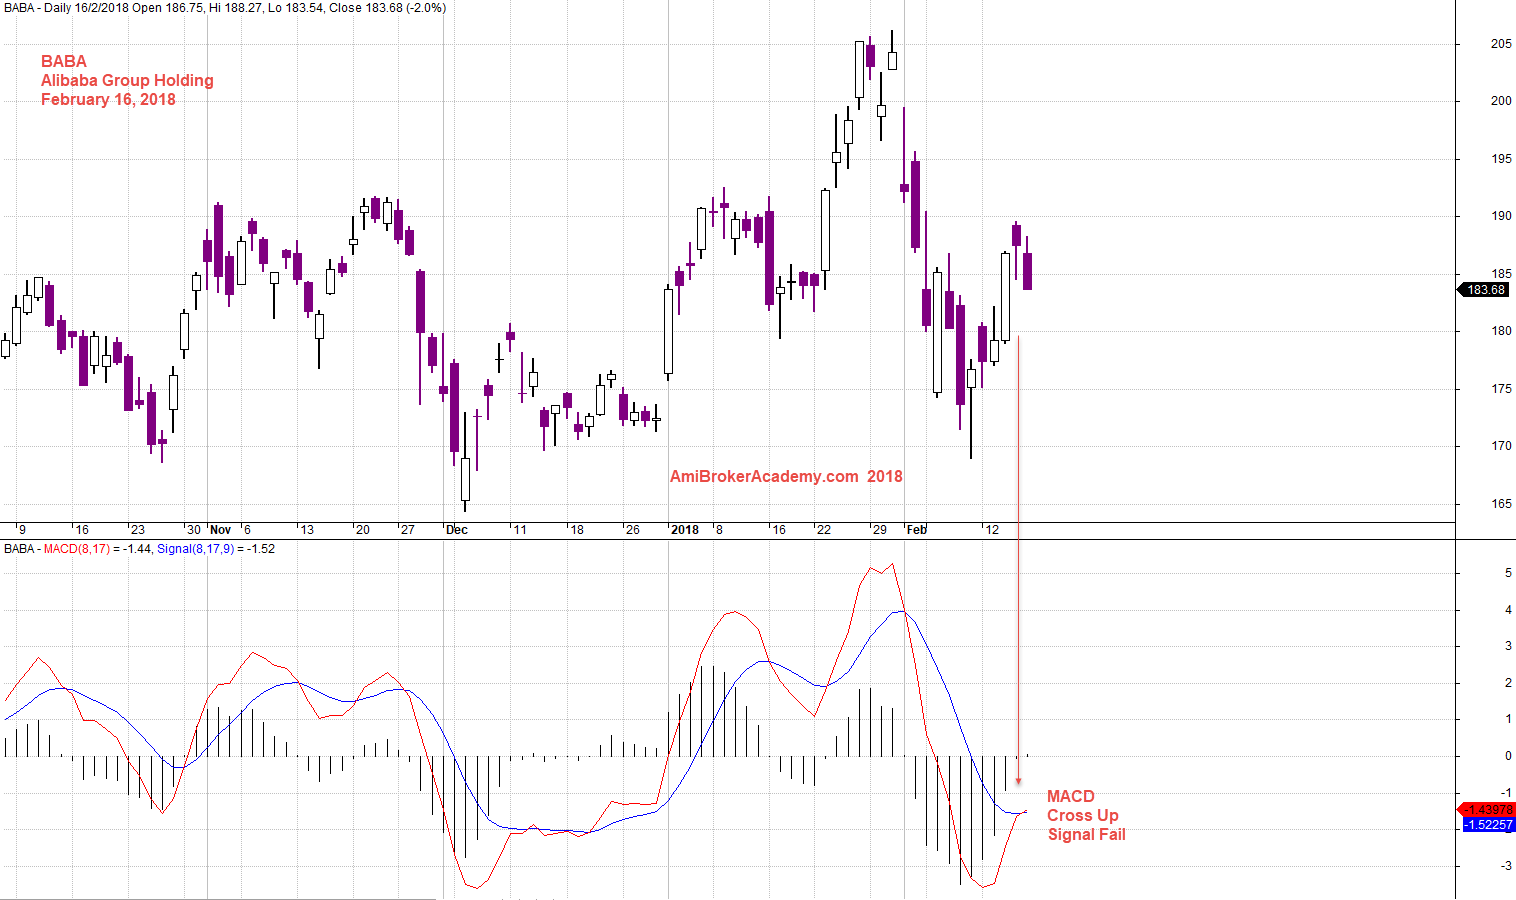
20180216 Alibaba Group Holding and MACD
Moses
AmiBrokerAcademy.com
Disclaimer
The above result is for illustration purpose. It is not meant to be used for buy or sell decision. We do not recommend any particular stocks. If particular stocks of such are mentioned, they are meant as demonstration of Amibroker as a powerful charting software and MACD. Amibroker can program to scan the stocks for buy and sell signals.
These are script generated signals. Not all scan results are shown here. The MACD signal should use with price action. Users must understand what MACD and price action are all about before using them. If necessary you should attend a course to learn more on Technical Analysis (TA) and Moving Average Convergence Divergence, MACD.
Once again, the website does not guarantee any results or investment return based on the information and instruction you have read here. It should be used as learning aids only and if you decide to trade real money, all trading decision should be your own.