August 19, 2017
Great Lesson!
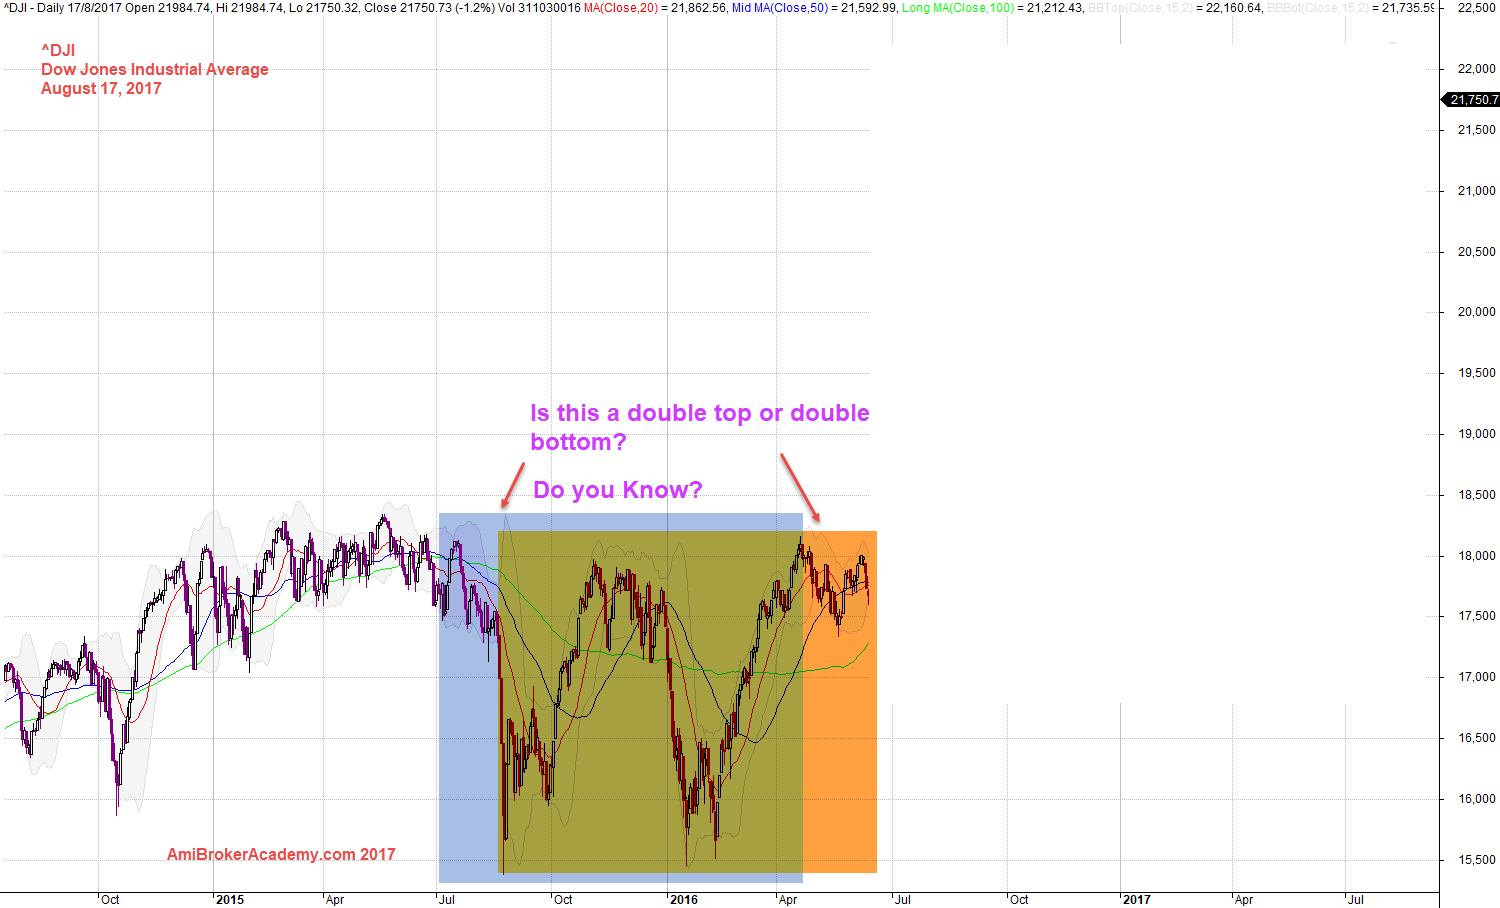
In the next two postings, we will demonstrate to you before the chart is really complete no one know the answer. Do you?
^DJI Dow Jones Industrial Average Index and Possible Setup
See chart for more, picture worth a thousand words.
See the chart below, there are two major possible setup. One bullish setup, the other bearish.
From the Gartley pattern view point, this might be a topping condition. Therefore, a double top scenario, another is also a Gartley setup, upflow and follow the ABCD pattern. So, which is which. We will show you.
August 18, 2017 Dow Jones Industrial Average – What’s Your Setup? A double top? Or a double bottom?
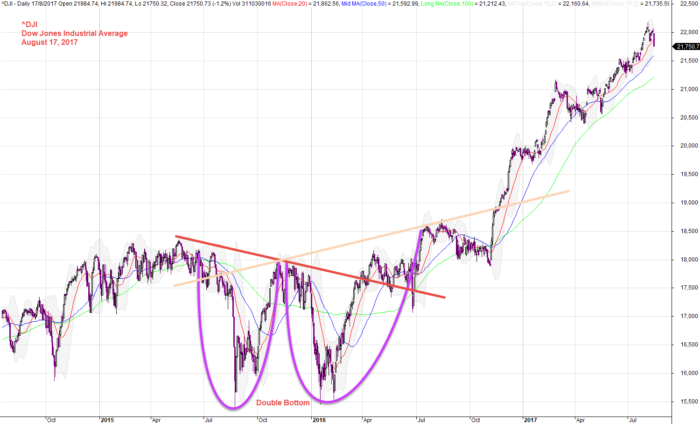
^DJI Dow Jones Industrial Average Index and Double Bottom Setup
Picture worth a thousand words, the chart shows the price action finally prove the success of double bottom setup. Even if you do not see double bottom, you are still alright.
See chart for more.
We use neckline as a reference to see the price action movement. We expect the price to draw near and breakout the neckline. Both neckline are correct. Have fun!
August 18, 2017 Dow Jones Industrial Average Index and Double Bottom
Thanks for visit the site here. You could also find free MACD scan here in this site too.
Moses
AmiBrokerAcademy.com
Disclaimer
The above result is for illustration purpose. It is not meant to be used for buy or sell decision. We do not recommend any particular stocks. If particular stocks of such are mentioned, they are meant as demonstration of Amibroker as a powerful charting software and MACD. Amibroker can program to scan the stocks for buy and sell signals.
These are script generated signals. Not all scan results are shown here. The MACD signal should use with price action. Users must understand what MACD and price action are all about before using them. If necessary you should attend a course to learn more on Technical Analysis (TA) and Moving Average Convergence Divergence, MACD.
Once again, the website does not guarantee any results or investment return based on the information and instruction you have read here. It should be used as learning aids only and if you decide to trade real money, all trading decision should be your own.