April 18, 2017
BIX Ellipsiz Charting and Bull Trapped
Ellipsiz providers semiconductor test services and products. The stock has moved from bottom left to top right. But the price can not breakout higher end March to top. Those who has missed the ride and jumped in are trapped now. Can the price breakout higher? See the chart follows for more.
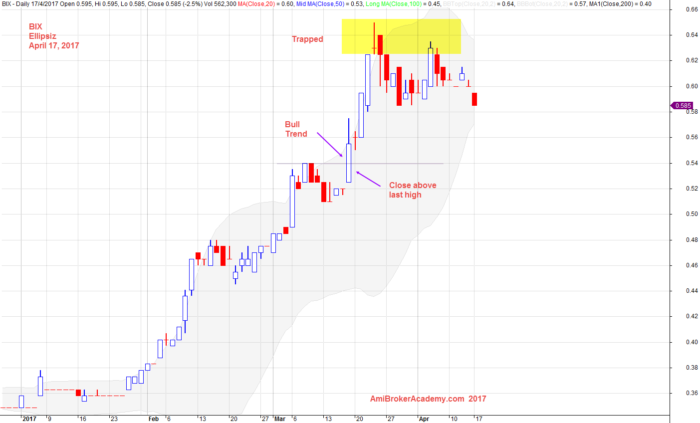
April 17, 2017 Ellipsiz and Trapped Bulls
BIX Ellipsiz Charting and 34 EMA Wave
The wave is near two o’clock direction, still bullish but start moving ranging. Let see another analysis for more.
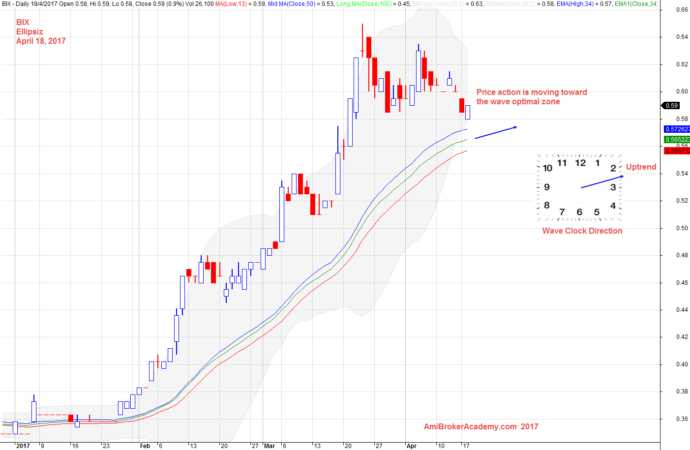
April 18, 2017 Ellipsiz and 34 EMA Wave
BIX Ellipsiz Charting and Channels and Bullish Flag
Remember all setup can fail. We see a potential bullish flag chart pattern in the forming.
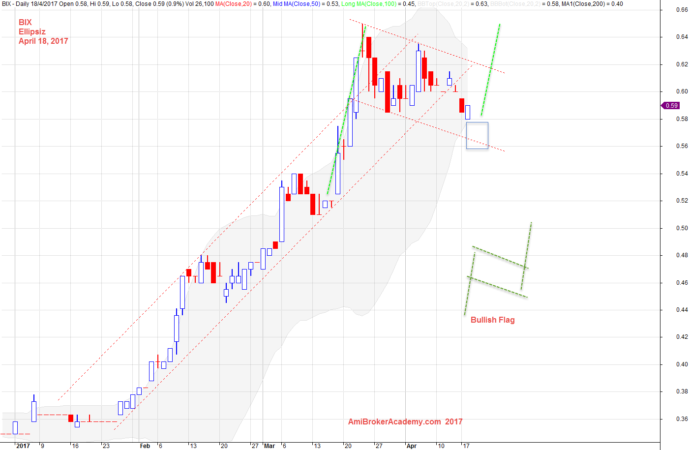
April 18, 2017 Ellipsiz Bullish Flag
Moses Stock Analysis
AmiBrokerAcademy.com
Disclaimer
The above result is for illustration purpose. It is not meant to be used for buy or sell decision. We do not recommend any particular stocks. If particular stocks of such are mentioned, they are meant as demonstration of Amibroker as a powerful charting software and MACD. Amibroker can program to scan the stocks for buy and sell signals.
These are script generated signals. Not all scan results are shown here. The MACD signal should use with price action. Users must understand what MACD and price action are all about before using them. If necessary you should attend a course to learn more on Technical Analysis (TA) and Moving Average Convergence Divergence, MACD.
Once again, the website does not guarantee any results or investment return based on the information and instruction you have read here. It should be used as learning aids only and if you decide to trade real money, all trading decision should be your own.