August 30, 2016
Early the year, we see majority of the stock was decline, but not for Golden Agri.
However, if you were familiar Gartley chart pattern, you may choose to sell near the high after AB = CD.
If so, you will probably laughing to the bank now.
See link for the last analysis, http://www.amibrokeracademy.com/amibroker/golden-agri-resources-e5h-is-it-time-for-reversal-buy/
Golden Agri Resources E5H Chart Analysis
Gartley 222 Chart Pattern is in action again. Non Random Walk of the market, will see.
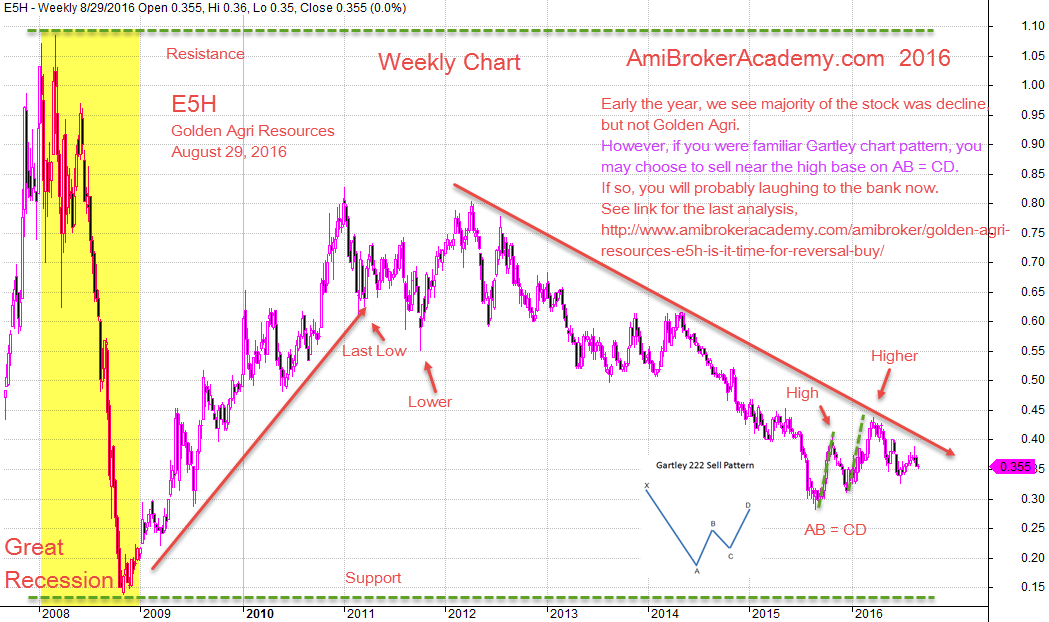
August 29, 2016 Golden Agri Resources Weekly Chart Data Since 2007
Big Picture
It is good to step back to see the big picture. We zoom out to see chart since 2007.
Moses Stock Column
AmiBrokerAcademy.com
Disclaimer: All information, data and material contained, presented, or provided on amibrokeracademy.com is for educational purposes only. It is not to be construed or intended as providing trading or legal advice. Decisions you make about your trading or investment are important to you and your family, therefore should be made in consultation with a competent financial advisor or professional. We are not financial advisor and do not claim to be. Any views expressed here-in are not necessarily those held by amibrokeracademy.com. You are responsible for your trade decision and wealth being.