October 22, 2017
What makes Dow or Dow Jones Industrial Average?
Dow is an index that shows how thirty (30) large publicly owned companies based in the United States have traded during a standard trading session in the stock market. Dow Jones Industrial Average is the second-oldest U.S. market index after the DJT, Dow Jones Transportation Average, which was also created by Dow.
Dow Gap
Thirty (30) Large Public Owned Companies all gap down or up on the same day, interesting right? Very, and it is not easy. But this happened, and just September and October in 2017 alone you can easily visually see seven of them. See chart for more.
Gap Up
Dow gap up, seven times (visually see the gap) seven times in just September and October 2017. Why?
Why Gap Up?
Gap up means stock price open higher on the next trading day. Gap down means stock price open lower on the next trading day.
Stock Gaps only occur because of underlying stock fundamental or technical factors. One example is when a company’s earnings are much higher than expected, the company’s stock may gap up on the next trading day. This means that the stock price opened higher than it closed the day before, thereby leaving a gap.
So, Dow Gap Up, means thirty (30) companies that make up of Dow Jones Industrial Average technical factors resulting these companies stock opened higher on the next trading day. Wow, not one time, but seven time just September and October in 2017 alone, Average three times a month. Make history, may be. Or this is the norm now. Will see.
^DJI Dow Jones Industrial Average and Gaps
Not just one gap, but seven gaps (only the visual one, see the white space in between). In other words, technically the market think the prices are too low. Wow, what an interesting phenomena.
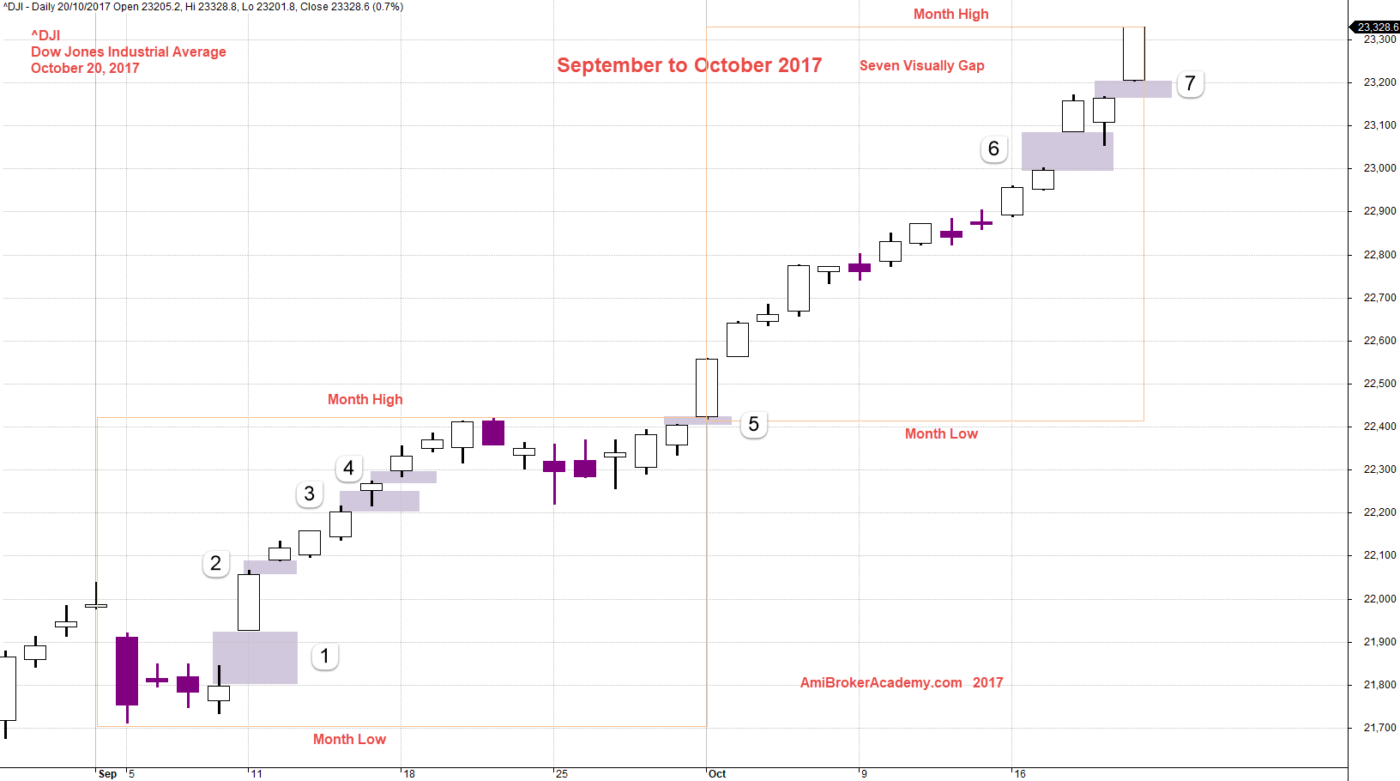
October 20, 2017 Dow Jones Industrial Average and Gaps
Moses
AmiBrokerAcademy.com
Read:
Disclaimer
The above result is for illustration purpose. It is not meant to be used for buy or sell decision. We do not recommend any particular stocks. If particular stocks of such are mentioned, they are meant as demonstration of Amibroker as a powerful charting software and MACD. Amibroker can program to scan the stocks for buy and sell signals.
These are script generated signals. Not all scan results are shown here. The MACD signal should use with price action. Users must understand what MACD and price action are all about before using them. If necessary you should attend a course to learn more on Technical Analysis (TA) and Moving Average Convergence Divergence, MACD.
Once again, the website does not guarantee any results or investment return based on the information and instruction you have read here. It should be used as learning aids only and if you decide to trade real money, all trading decision should be your own.