Welcome to AmiBrokerAcademy.com Moses Stock Analysis Column.
Break the Neckline on Double Bottom?
Dow Jones Industrial Average has been on a declining right at the start of 2016. However, it has into a double bottom chart pattern since then. Can DJI break the neckline for the double bottom? Will see.
Will it depending on China economy? Wow! There are too many fundamental need to study in order can complete the analysis.
Picture Worth a Thousands Words
What chart patterns have you seen so far? Head and Shoulders, Double Bottom, and what else?
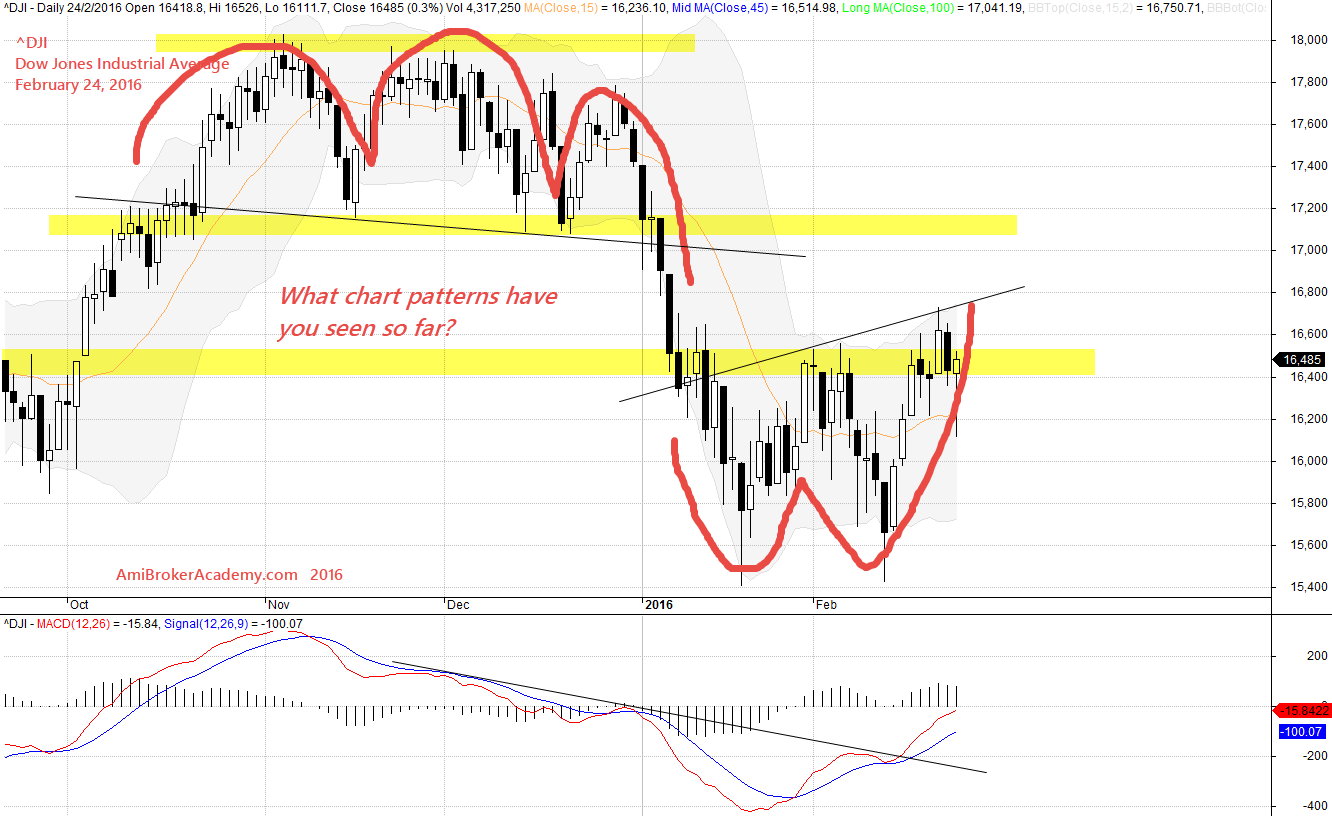
February 24, 2016 Dow Jones Industrial Average, ^DJI
MACD is showing weakness; potentially the price may be changing direction. There are chart pattern on MACD too. Check it out!
Moses US Stocks Analysis and Scan
Disclaimer: All information, data and material contained, presented, or provided on amibrokeracademy.com is for educational purposes only. It is not to be construed or intended as providing trading or legal advice. Decisions you make about your trading or investment are important to you and your family, therefore should be made in consultation with a competent financial advisor or professional. We are not financial advisor and do not claim to be. Any views expressed here-in are not necessarily those held by amibrokeracademy.com. You are responsible for your trade decision and wealth being.