January 30, 2018
US Stock Analysis
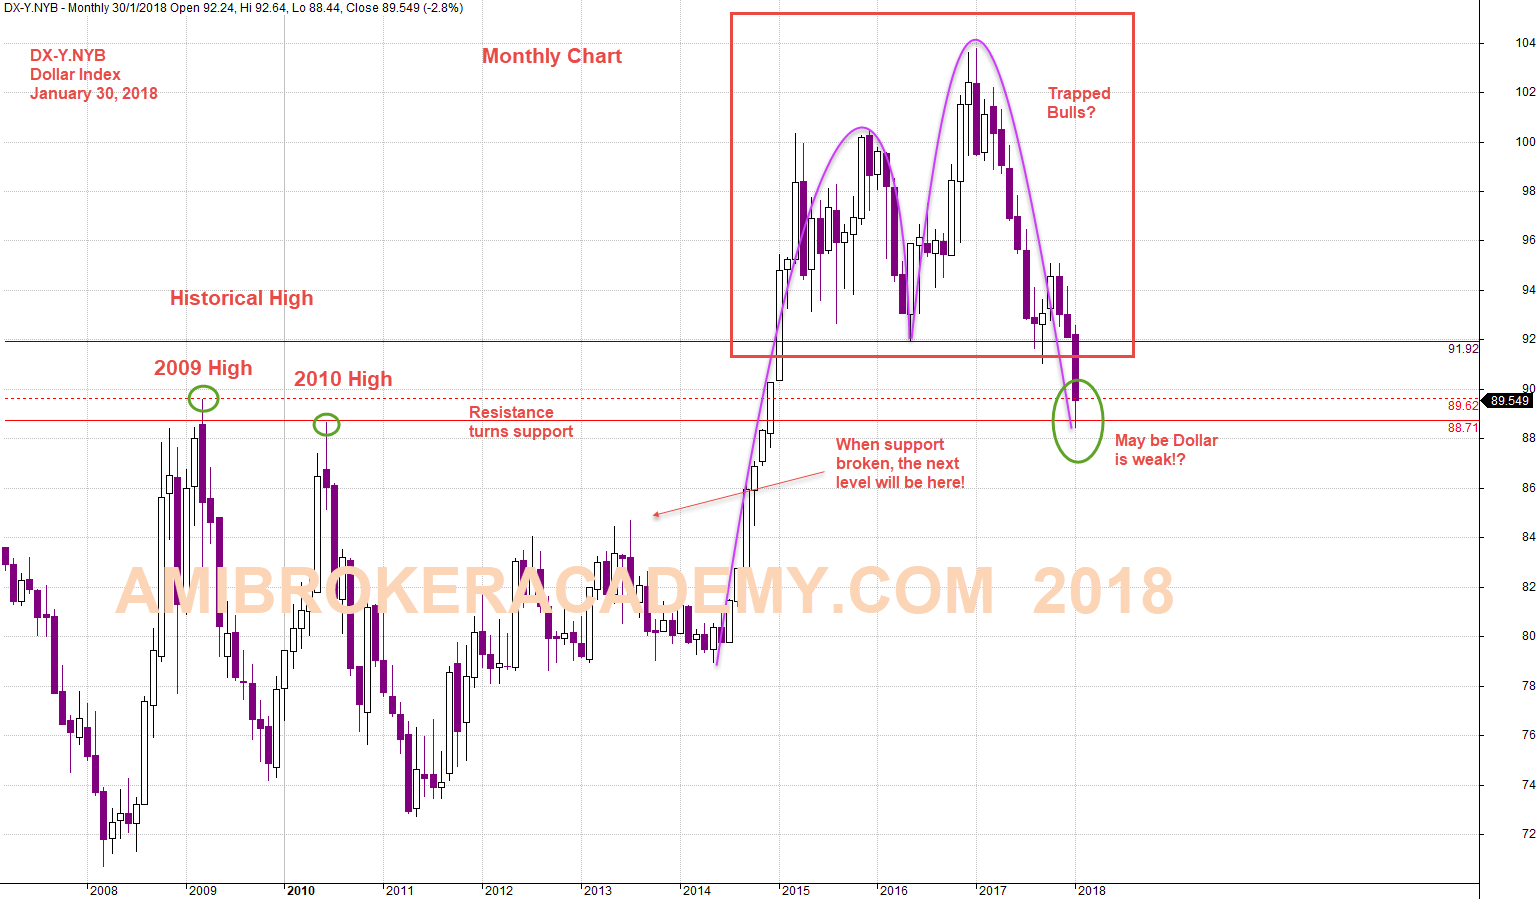
DX-Y.NYB Dollar Index Monthly Chart
Last week, we study Dollar Index as the World Economic Forum 2018 has generated a lot of interest in where will the Dollar head for the near future. Read Mnuchin and Trump speech on the forum.
Study the monthly chart, you will notice that the Year 2009 High and Year 2010 High may be the support to hold the fall of the Dollar Index. Picture worth a thousand words, see chart for more.
Manage your risk!
Powerful Chart Software – AmiBroker
The following chart is produced using AmiBroker charting software. It is a powerful chart software. You plot the stocks you are interested all in one chart, as long as you still could read them. See chart below.
January 30, 2018 Dollar Index Monthly Charting
DX-Y.NYB Dollar Index Weekly Chart
See chart for more.
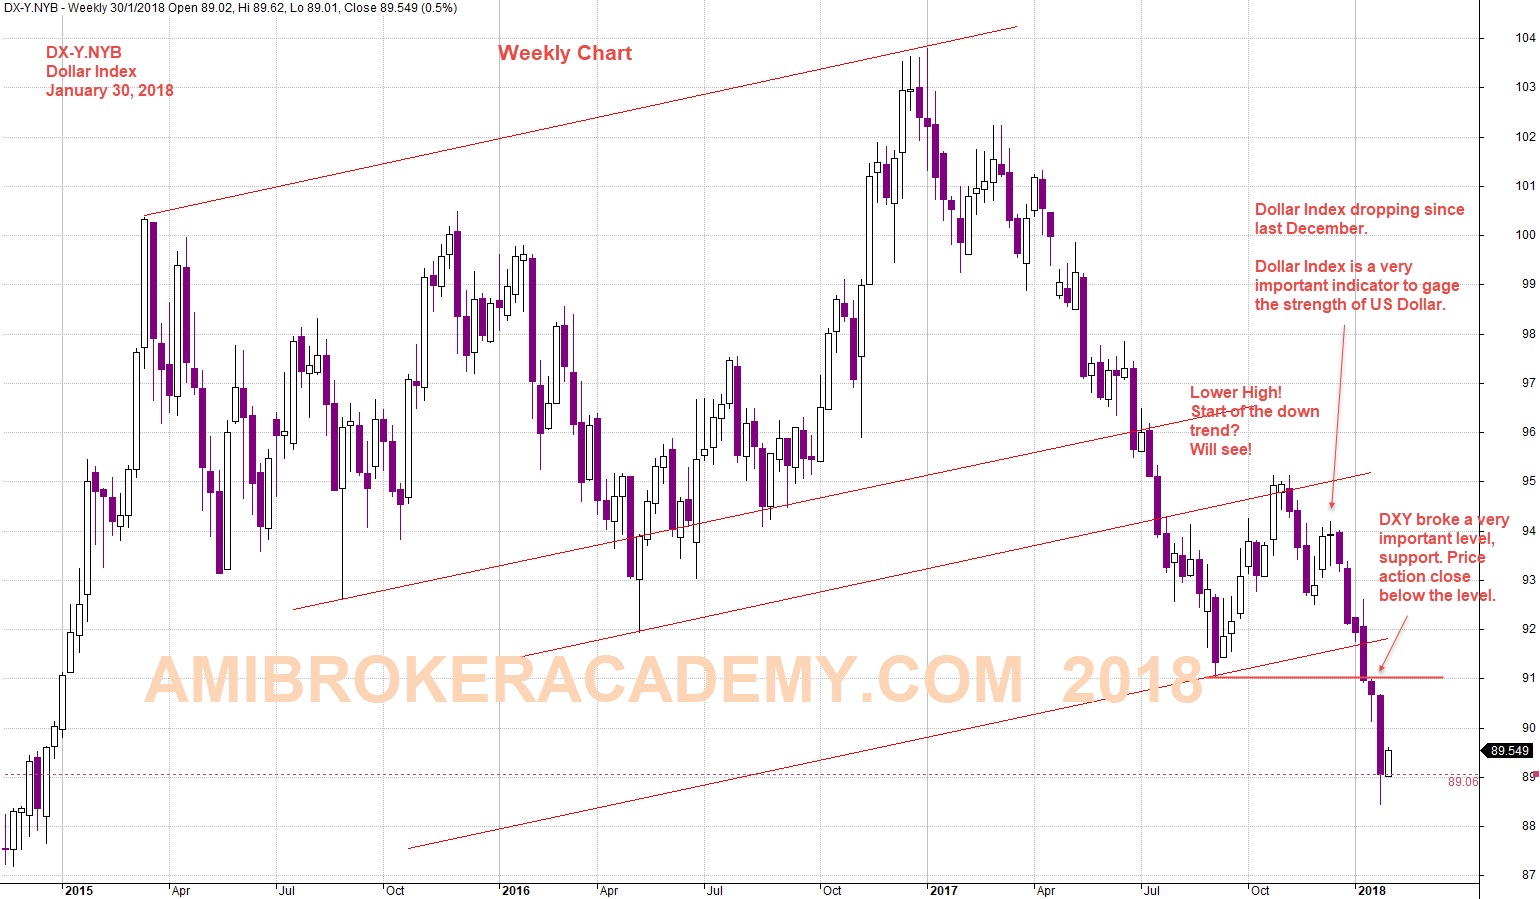
January 30, 2018 Dollar Index Weekly Chart
DX-Y.NYB Dollar Index ABCD Patterns
If you want to know where will the Dollar index ended in the near future, see chart the last ABCD pattern, if the trend follow the CD leg. Manage your risk, as all set up can fail.
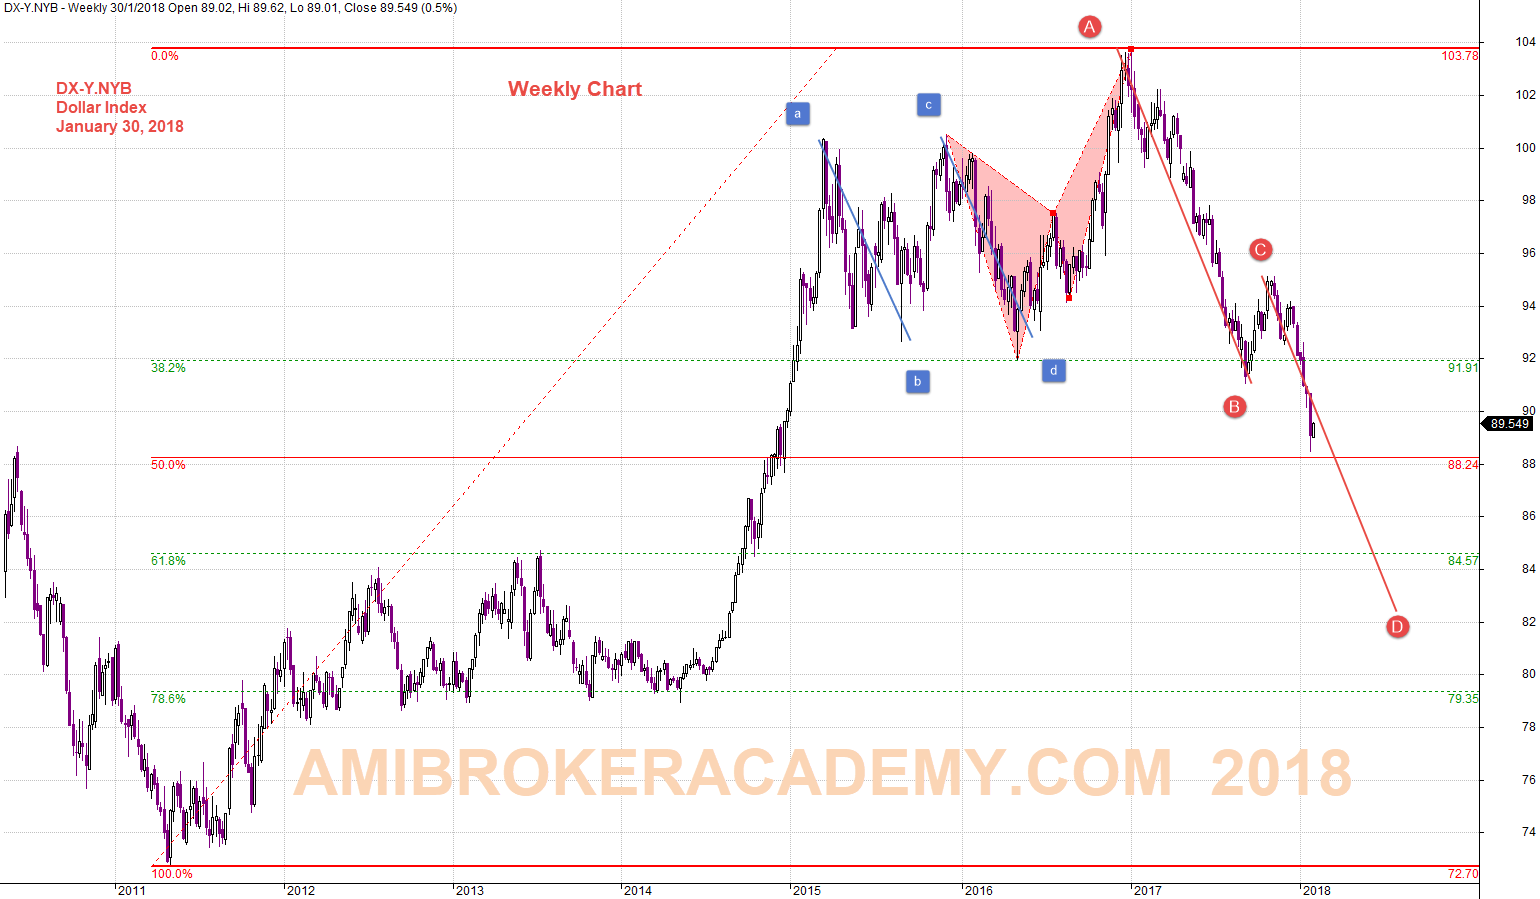
January 30, 2018 Dollar Index and ABCD Pattern
DX-Y.NYB Dollar Index and Fibonacci Levels
To make it even more, predictable. Let’s add the Fibonacci, from the levels, we can understand why the price action. See chart for more.
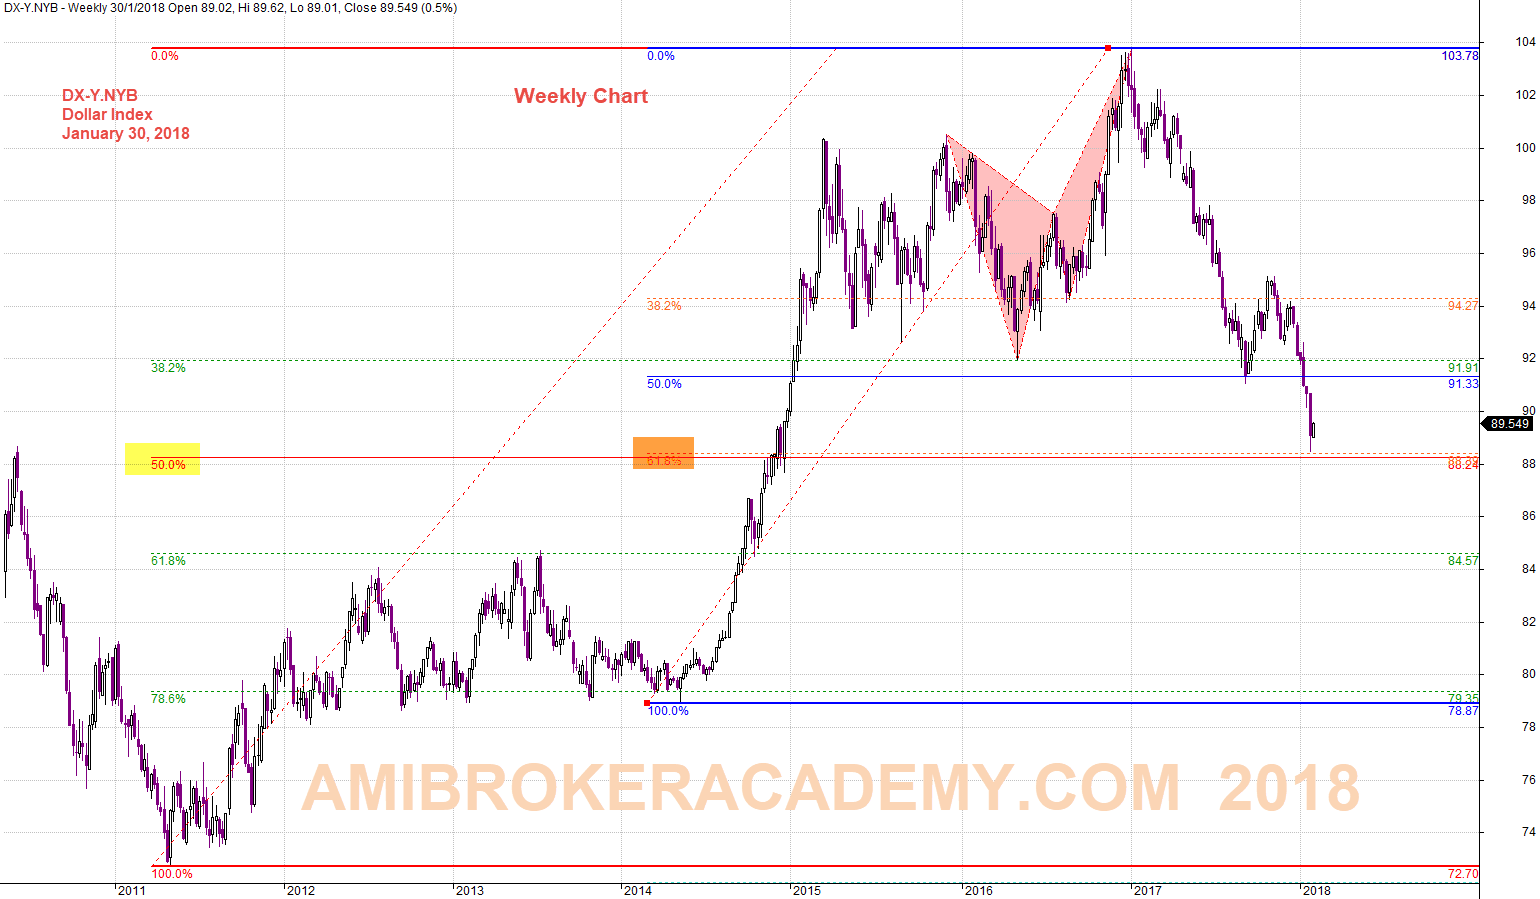
January 30, 2018 Dollar Index and Fibonacci Levels
Moses
AmiBrokerAcademy.com
Disclaimer
The above result is for illustration purpose. It is not meant to be used for buy or sell decision. We do not recommend any particular stocks. If particular stocks of such are mentioned, they are meant as demonstration of Amibroker as a powerful charting software and MACD. Amibroker can program to scan the stocks for buy and sell signals.
These are script generated signals. Not all scan results are shown here. The MACD signal should use with price action. Users must understand what MACD and price action are all about before using them. If necessary you should attend a course to learn more on Technical Analysis (TA) and Moving Average Convergence Divergence, MACD.
Once again, the website does not guarantee any results or investment return based on the information and instruction you have read here. It should be used as learning aids only and if you decide to trade real money, all trading decision should be your own.