March 4, 2016
Welcome to AmiBrokerAcademy.com.
Besides we advocate ABCD chart pattern, we also do MACD analysis. ABCD chart pattern gives the possible projection of the trend, MACD provide the strength and possible change in trend direction.
Divergence – Straits Times Index Moves
Look left and think right. We see price action in ranging; moving sideways and keep testing the same support. MACD is forming a higher high; showing weakness. It signals a potential in changing price action (index) may change in direction.
It is confirmed by golden crosses, and breakout of trendline.
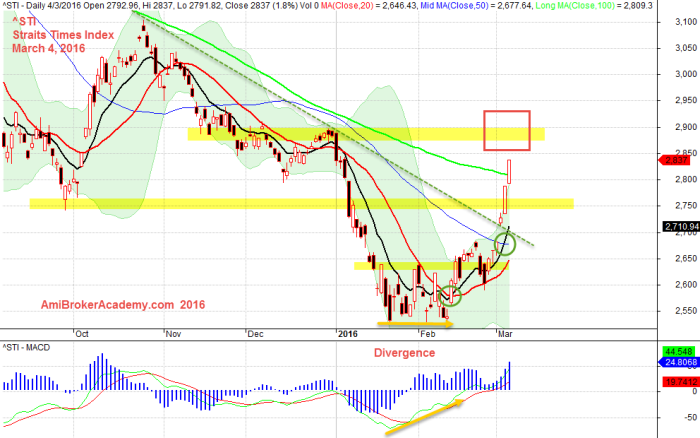
March 4, 2016 Straits Times Index Daily
Moses Stocks Analysis and Scan
Disclaimer: All information, data and material contained, presented, or provided on amibrokeracademy.com is for educational purposes only. It is not to be construed or intended as providing trading or legal advice. Decisions you make about your trading or investment are important to you and your family, therefore should be made in consultation with a competent financial advisor or professional. We are not financial advisor and do not claim to be. Any views expressed here-in are not necessarily those held by amibrokeracademy.com. You are responsible for your trade decision and wealth being.