February 14, 2017
Welcome to Moses’s Singapore Stock Analysis @ AmiBrokerAcademy.com.
The three major local banks FY2016 Results
- 14 February 2017 – OCBC 2016 Full Year Results
- 16 February 2017 – DBS 2016 Full Year Results
- 17 February 2017 – UOB 2016 Full Year Results
DBS Bank Stock Chart and Support and Resistance For Last Five Months
From the chart you can see the stock breakout of resistance. The stock price is higher than the last December high. In February, the price close lower. Trade what you see.
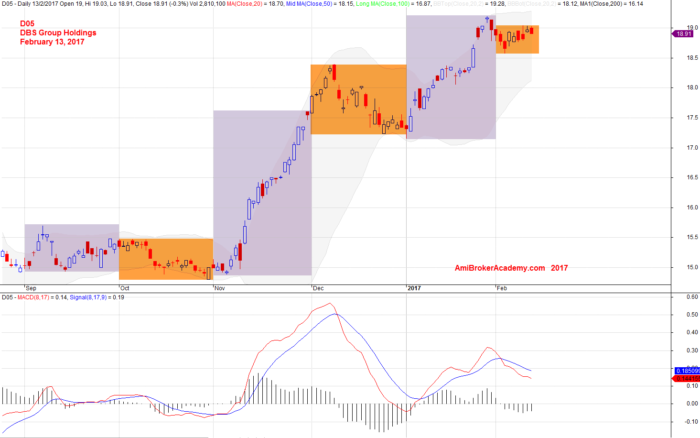
February 13, 2017 DBS Group Holdigs and MACD
DBS Bank Stock Chart and Support and Resistance For 2016
The stock price moves higher than 2016 high. Stock price pullback to retest the 2016 high.
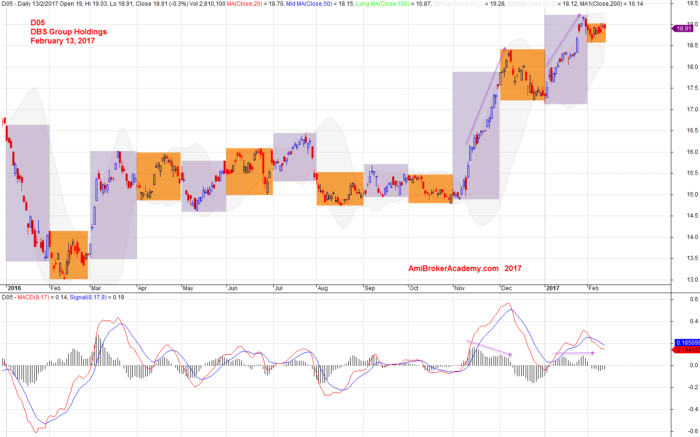
February 13, 2017 DBS Group Holdings 2016
Moses
AmiBrokerAcademy.com
Disclaimer
The above result is for illustration purpose. It is not meant to be used for buy or sell decision. We do not recommend any particular stocks. If particular stocks of such are mentioned, they are meant as demonstration of Amibroker as a powerful charting software and MACD. Amibroker can program to scan the stocks for buy and sell signals.
These are script generated signals. Not all scan results are shown here. The MACD signal should use with price action. Users must understand what MACD and price action are all about before using them. If necessary you should attend a course to learn more on Technical Analysis (TA) and Moving Average Convergence Divergence, MACD.
Once again, the website does not guarantee any results or investment return based on the information and instruction you have read here. It should be used as learning aids only and if you decide to trade real money, all trading decision should be your own.