April 25, 2017
The quarterly report will be available soon. So, sell? Hold? Will see.
Is It Time to Take Profit Before Trapped?
This is the question that all traders want to know…when the heck should I exit to either take profit or get out?
D05 DBS Group Holdings Daily
Price keeps bouncing off above the moving average, bullish trend. The MA band crosses from bottom left to top right, bullish trend. However, the MA starting to be on the thee o’clock direction. So the ranging has began.
Picture worth a thousand words. See chart for more.
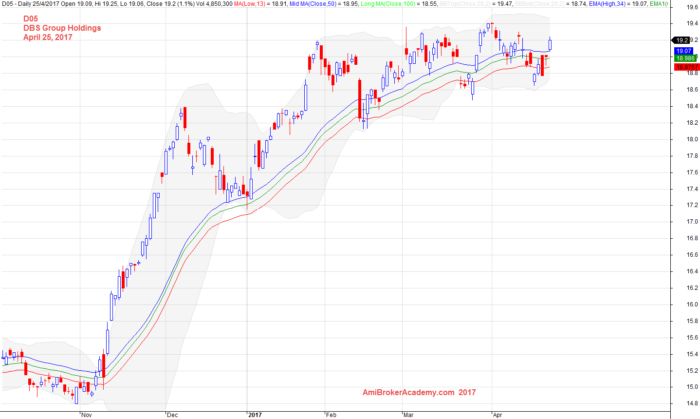
April 25, 2017 DBS Group Holdings and 34 EMA Wave
D05 DBS Group Holdings Daily and Channel
We see narrow channel. The price is very bullish. Draw two lines, two parallel lines. The price trapped within the two lines. Buy when price near lower band with bullish candle, and sell when price near top channel with bearish candle.
Picture worth a thousand words.
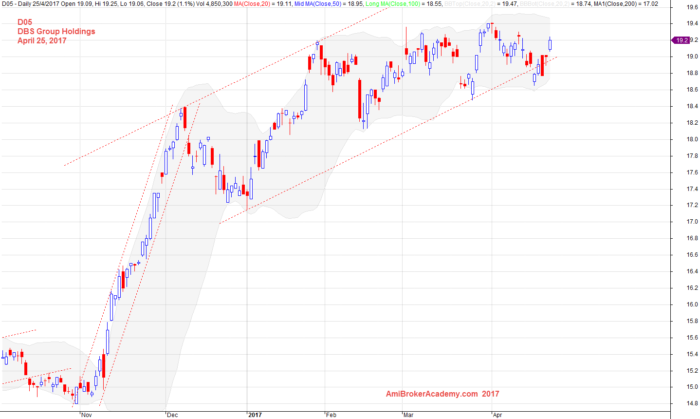
April 25, 2017 DBS Group Holdings and Channel
D05 DBS Group Holdings Daily and Channel
Look for the month high and low to find ‘good’ support and resistance. We see the price is now resisted by the resistance.
The price keeps testing the high and fail. Can the price finally breakout higher? Will see.
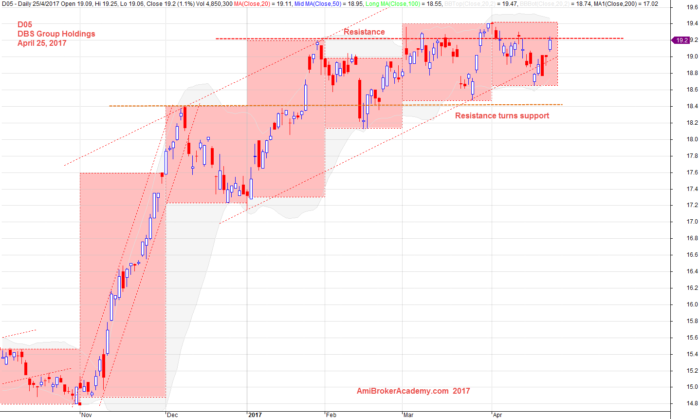
April 25, 2017 DBS Group Holdings and Support and Resistance
Moses Stock Analysis
AmiBrokerAcademy.com
Disclaimer
The above result is for illustration purpose. It is not meant to be used for buy or sell decision. We do not recommend any particular stocks. If particular stocks of such are mentioned, they are meant as demonstration of Amibroker as a powerful charting software and MACD. Amibroker can program to scan the stocks for buy and sell signals.
These are script generated signals. Not all scan results are shown here. The MACD signal should use with price action. Users must understand what MACD and price action are all about before using them. If necessary you should attend a course to learn more on Technical Analysis (TA) and Moving Average Convergence Divergence, MACD.
Once again, the website does not guarantee any results or investment return based on the information and instruction you have read here. It should be used as learning aids only and if you decide to trade real money, all trading decision should be your own.