February 23, 2018
You can expect to have a very special situation this year, just at the beginning of the year. US stock leading the world into market correction. Have you ever think why now and not six months ago?
Judgement while your awareness and emotions are both in control.
Eighth Day CNY and Story
Everyday in the fifteen day of CNY all has it unique meaning. This is a day the many will thanks the Heavenly God and pray for another good year.
Many will use sugar cane, a pair of sugar cane plant during the offering. There is story on why a sugar cane plant are necessary, … once upon a time, during the second world war. At one of the attack, the village people run into a sugar cane plantation and the escape safe their life. Since then every eighth day of CNY, people to memories the incident. They make sure they find a pair of sugar cane. Of course, you may have a different version of story. but it is okay. Be happy.

Eighth Day CNY (Source: What’s Apps Group)
Powerful Chart Software – AmiBroker
The following chart is produced using AmiBroker charting software. It is a powerful chart software. You plot the stocks you are interested all in one chart, as long as you still could read them. See chart below. Thereafter slowly climb up, step by step.
D05 DBS Group Holdings and Fibonacci Extension
See chart for more, picture worth a thousand words the price action swing low from the low of 2017 to July high. Price action is making a 238% extension. Be careful of setting your hopes too high, though.
Manage your risk.
Past week has been a tough market for those strong heart treaders.
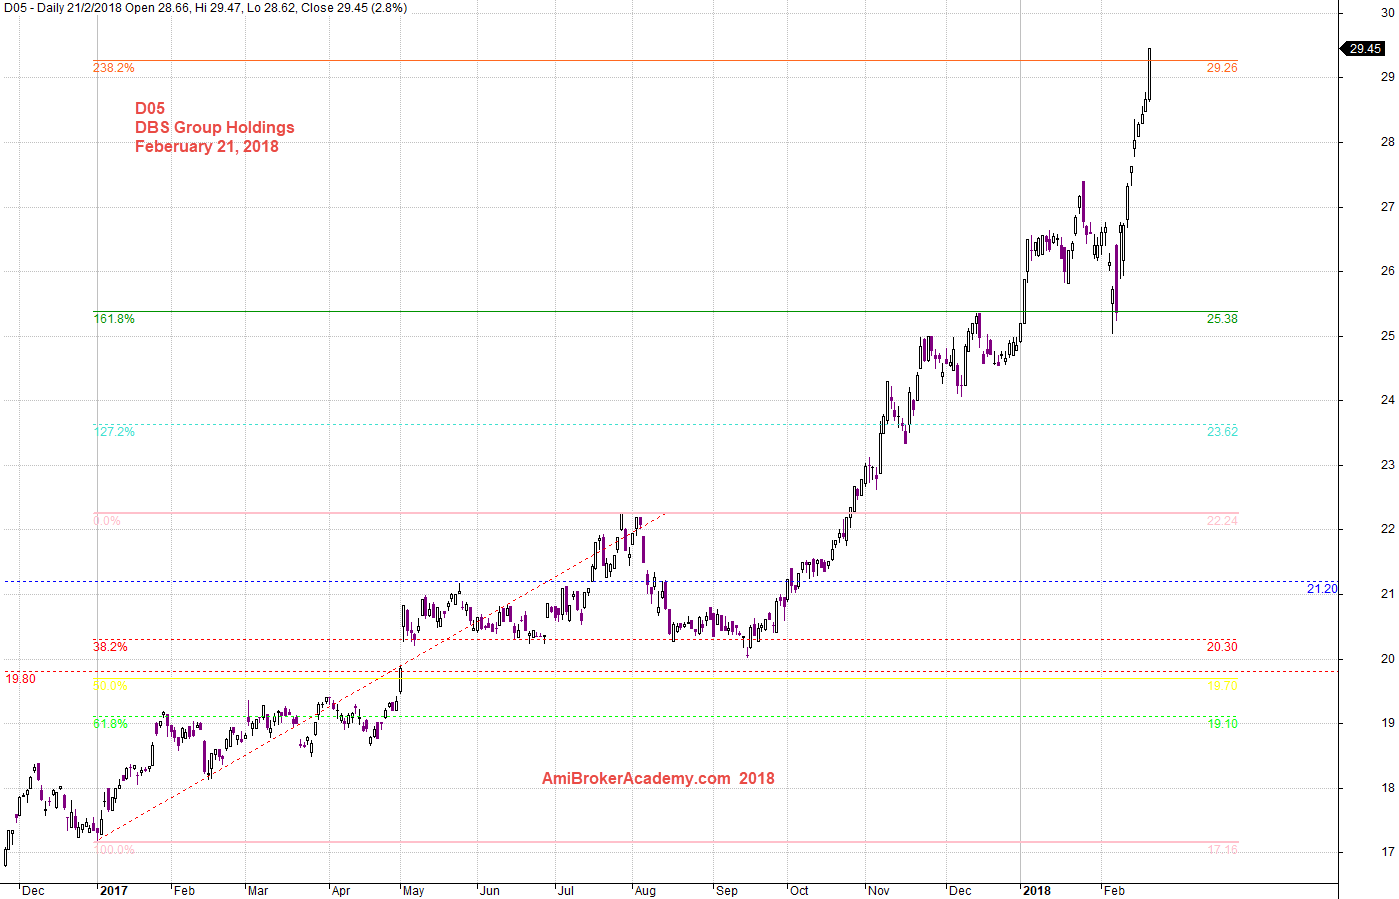
February 21, 2018 DBS Group Holdings and Fibonacci Extension
D05 DBS Group Holdings and MA Band
Let’s study the chart using other tools, such as MA Band. We see a slopping up MA, and continue a slopping up MA. Trend continue.
Manage your risk.
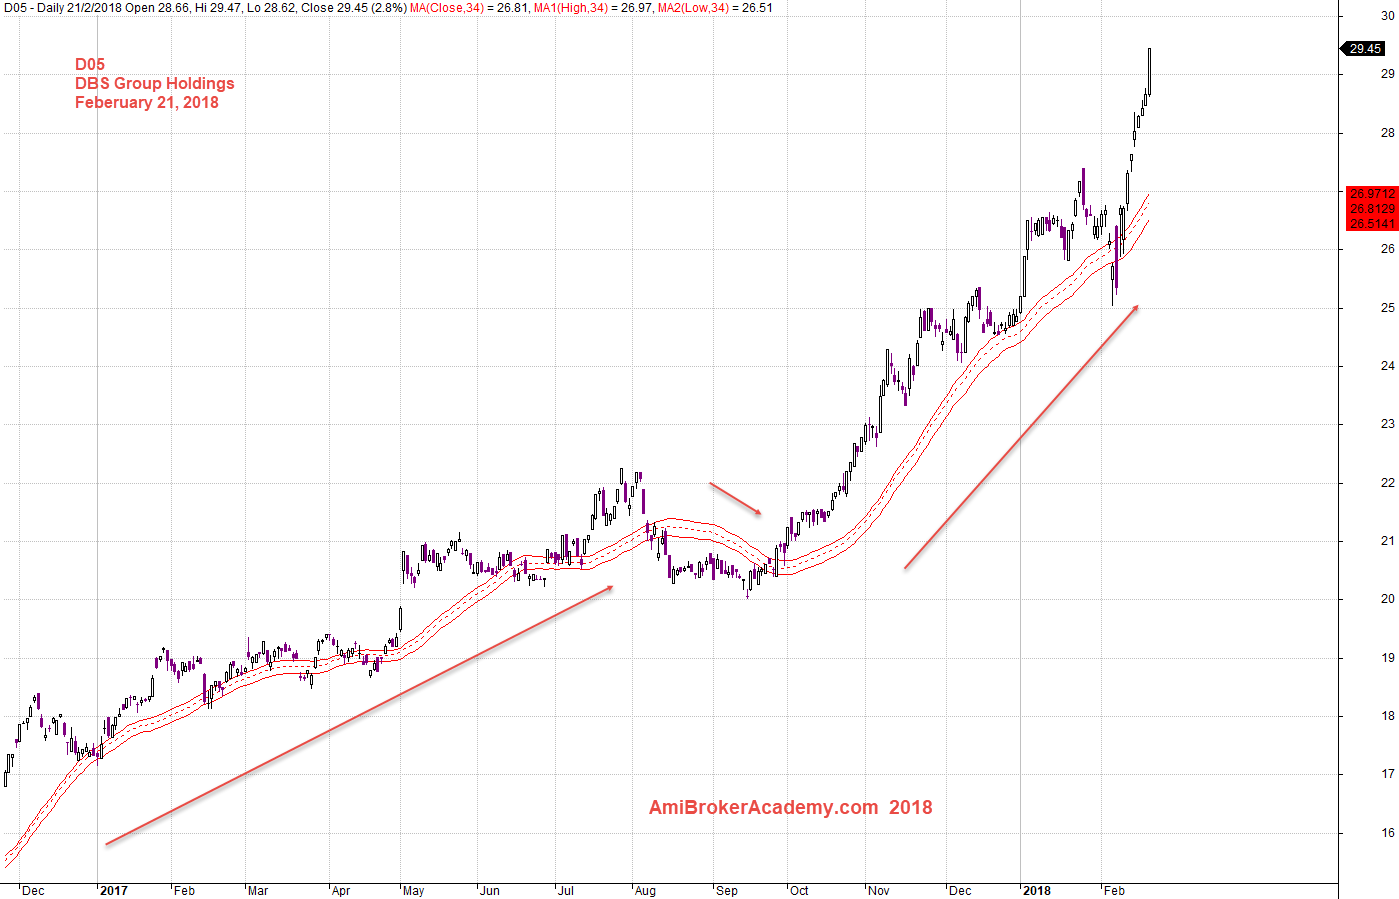
20180221 DBS Group Holdings and MA Band
Moses
AmiBrokerAcademy.com
Disclaimer
The above result is for illustration purpose. It is not meant to be used for buy or sell decision. We do not recommend any particular stocks. If particular stocks of such are mentioned, they are meant as demonstration of Amibroker as a powerful charting software and MACD. Amibroker can program to scan the stocks for buy and sell signals.
These are script generated signals. Not all scan results are shown here. The MACD signal should use with price action. Users must understand what MACD and price action are all about before using them. If necessary you should attend a course to learn more on Technical Analysis (TA) and Moving Average Convergence Divergence, MACD.
Once again, the website does not guarantee any results or investment return based on the information and instruction you have read here. It should be used as learning aids only and if you decide to trade real money, all trading decision should be your own.