November 17, 2017
BABA Alibaba Group Holding and Record Breaking After Single Day Sales
When a trend is form, it will continue. If you have movie of Titanic; to change direction is not instance. See chart, when price start to form lower high, it is the same, may take some time for it to turn around. Please monitor.
Can 192 to be break in the near future, such as before 2017 is over? Will see.
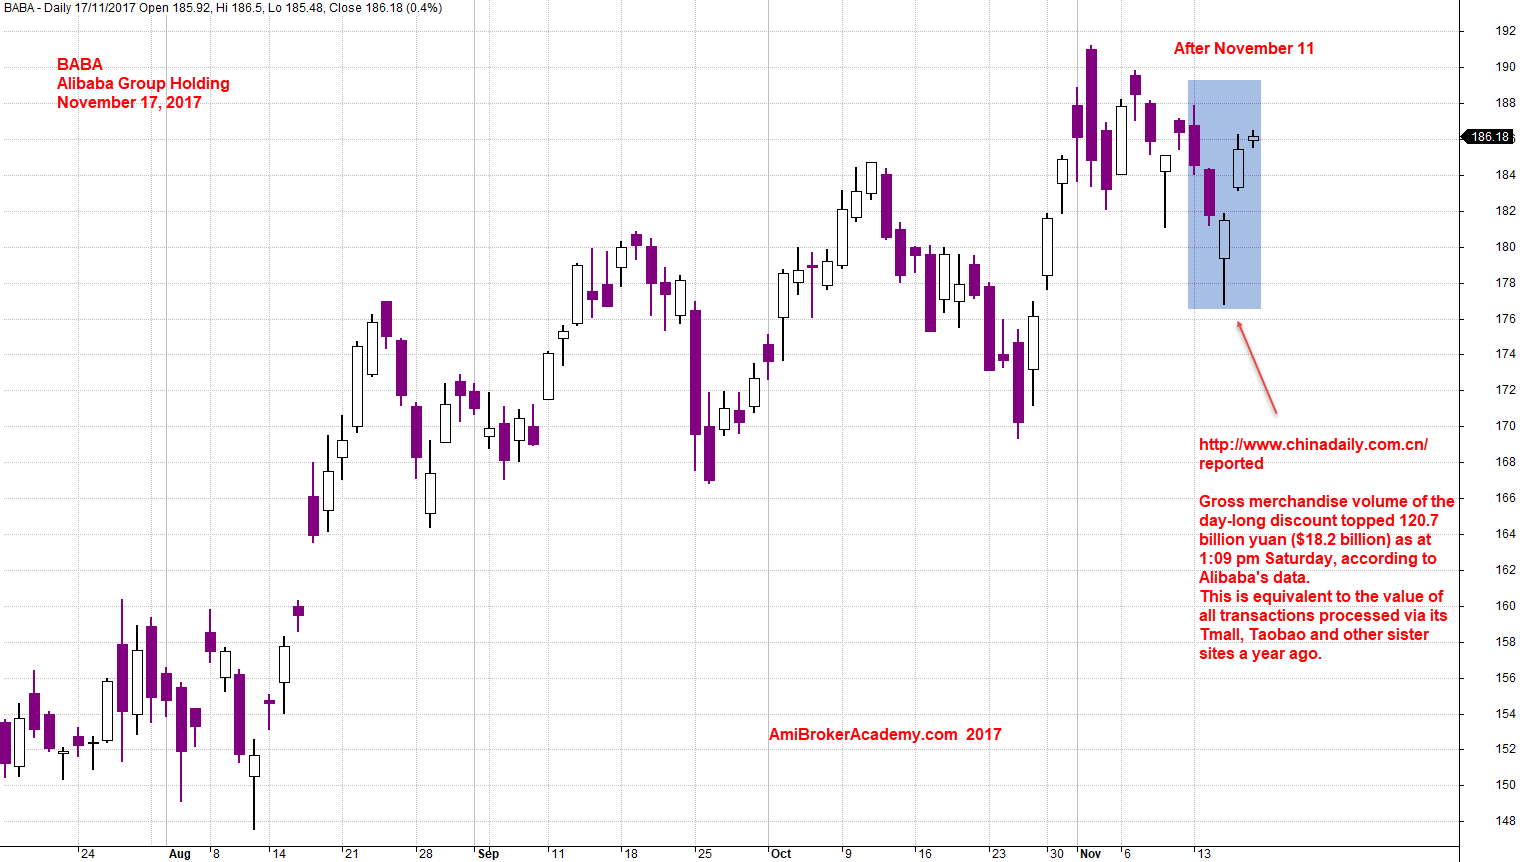
November 17, 2017 Alibaba Group Holding and the week after Record breaking Single Day Sales on November 11
Alibaba Group Holding and Channel
Use channel to guide your price action trend. See the price action is trapped within channel. … What have you got out of this channel?
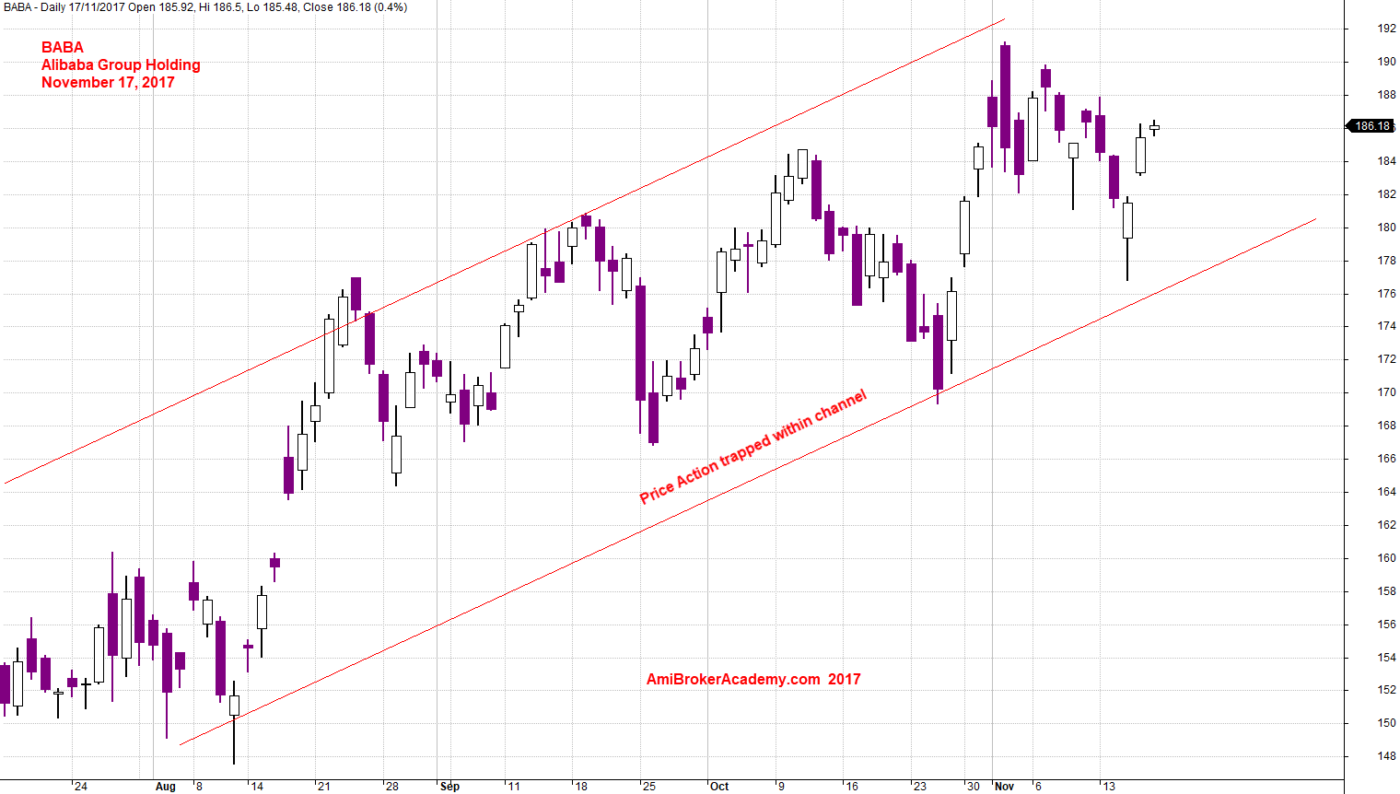
November 17, 2017 Alibaba Group Holding and Channel
BABA Alibaba Group Holding and Bearish Trend
See chart for more, if your observant you will notice the chart the price action continue to form higher high. Only until the bar start to close below such as the blue line we drawn. The bearish trend may be just begin. Watch the move.
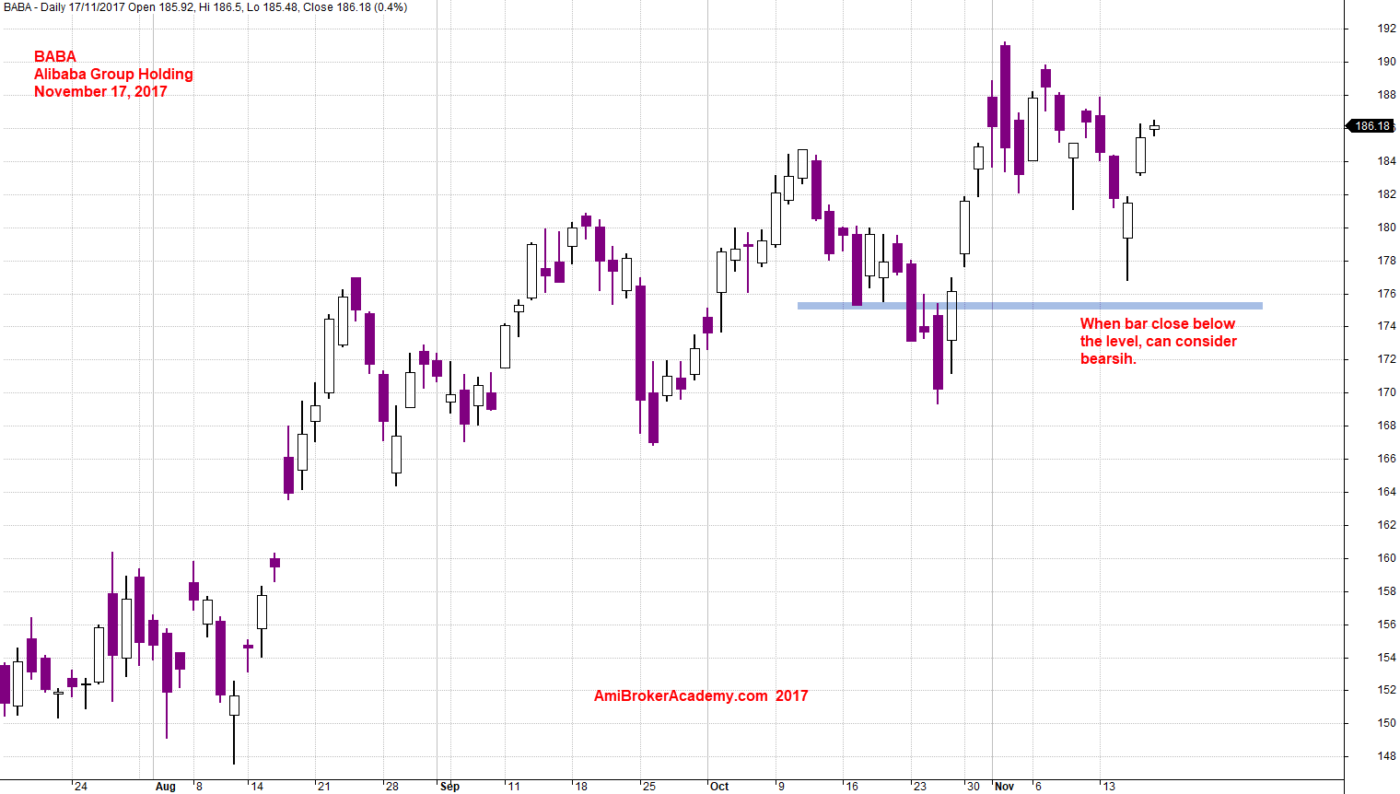
November 17, 2017 Alibaba Group Holding and Bearish Trend
HM Gartley ABCD Pattern, Support Resistance, Channel and Moving Average are great tool to reference for trade. Have fun!
Think Think
Think think got more thing, just in case, we are not AmiBroker, we are just AmiBroker’s fan and enthusiast. Contact them for more. Kudos to Tomasz Janeczko, the founder of AmiBroker.
Moses
AmiBrokerAcademy.com
Disclaimer
The above result is for illustration purpose. It is not meant to be used for buy or sell decision. We do not recommend any particular stocks. If particular stocks of such are mentioned, they are meant as demonstration of Amibroker as a powerful charting software and MACD. Amibroker can program to scan the stocks for buy and sell signals.
These are script generated signals. Not all scan results are shown here. The MACD signal should use with price action. Users must understand what MACD and price action are all about before using them. If necessary you should attend a course to learn more on Technical Analysis (TA) and Moving Average Convergence Divergence, MACD.
Once again, the website does not guarantee any results or investment return based on the information and instruction you have read here. It should be used as learning aids only and if you decide to trade real money, all trading decision should be your own.