January 28, 2018
US Stock Analysis
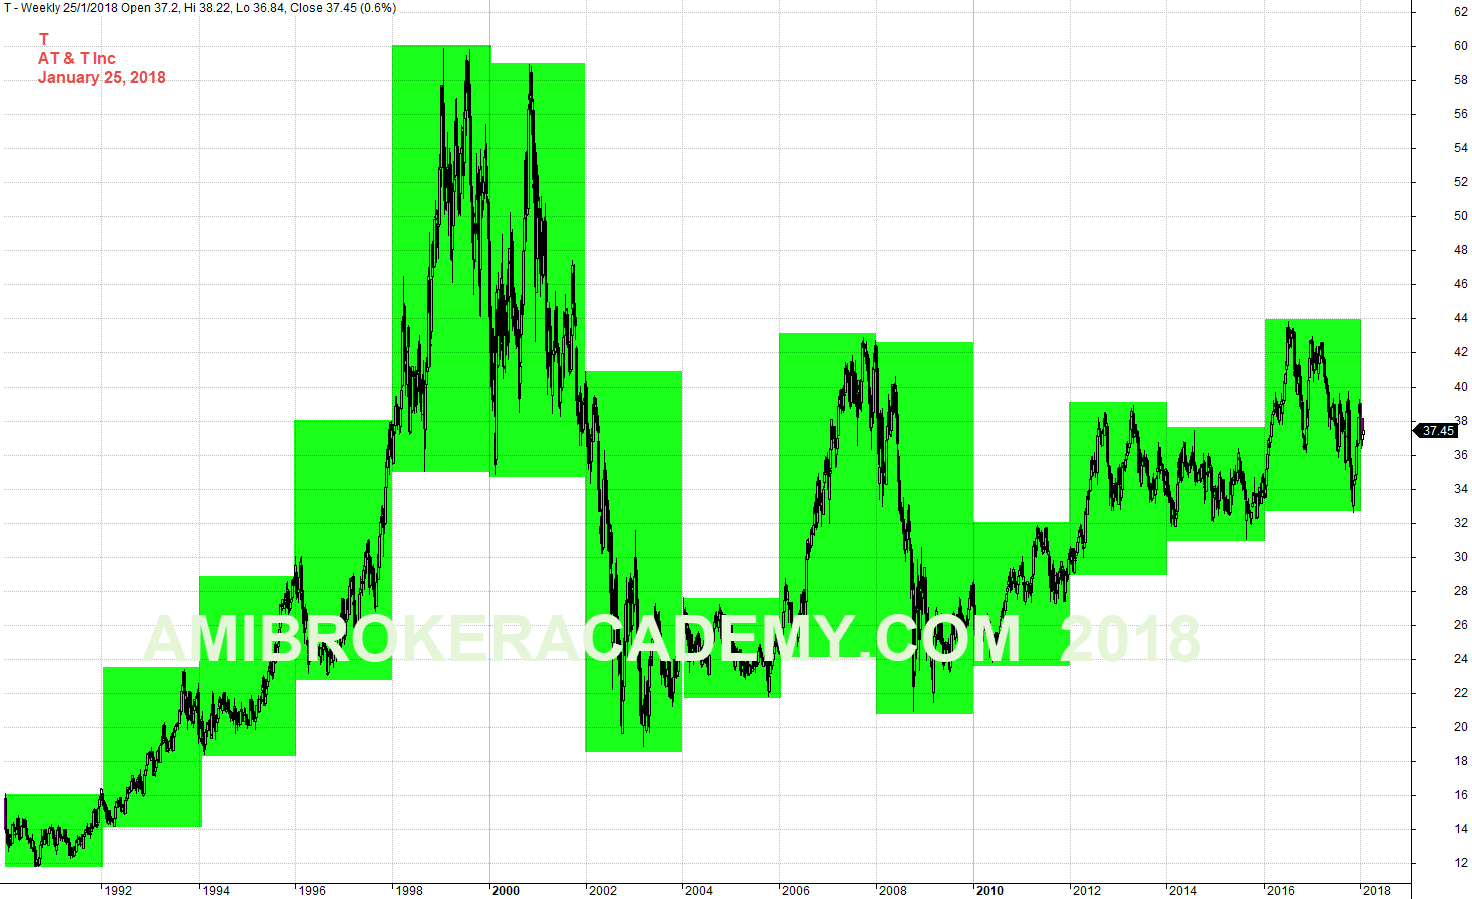
(Stock Code T) AT & T Weekly Year High Low From 1992
AT&T has been around for years. If you study the stock from the early years said from 1992, the stock raised to the peak in 1998, had a big dropped in great recession, but instantly pick up again and the test the same high or near the same high on the following year 2000. The real strong stock, the market has a lot of confident about the stock, of course. As AT & T is dominating the phone and communication business in US. However, the stock price started to fall from the high to even lower that the recession. Why? The stock price nearly break through the floor of 18 dollars. Wow! What a great market force to bring the stock to the knee.
Boxes of year high low is a great visual tool, you can see the stock had test a lower high twice, means the same high near 44. As the market has change so much, the interest of the traders probably get distracted, the stock can not move much higher, although it is still bullish after the 2008 recession.
While the Indexes kept forming higher high, but this stock was going the opposite direction, move south. Why? Don’t know. May be the stocks are not inline with the market. You see, copper wire technology has been survey for years, but the recent year has phase them out. Besides that, the new phone technologies have push the communication to work harder and harder, no longer making easy money, so call zero cost business; one time investment and little or no maintenance. Today, the phones and communication have moved from copper to fibber, and G, 2G, 3G, 5G and so on. If the companies do not keep up with the change, they will erase from the map. You can see many of the companies, especially those depending on digital, you can see many computer and PC companies have disappeared from the vocab of the younger generation. For example, try to as a ten years old boy, Atari. It is hard for me to know this gaming pc. No right no wrong. The points is do not bang on the technologies company too much.
The win for a reason, the lost is not their choice (but by the market forces).
Have fun learning!
Manage your risk!
Powerful Chart Software – AmiBroker
The following chart is produced using AmiBroker charting software. It is a powerful chart software. You plot the stocks you are interested all in one chart, as long as you still could read them. See chart below.
January 26, 2018 AT & T Weekly Year High Low From 1002
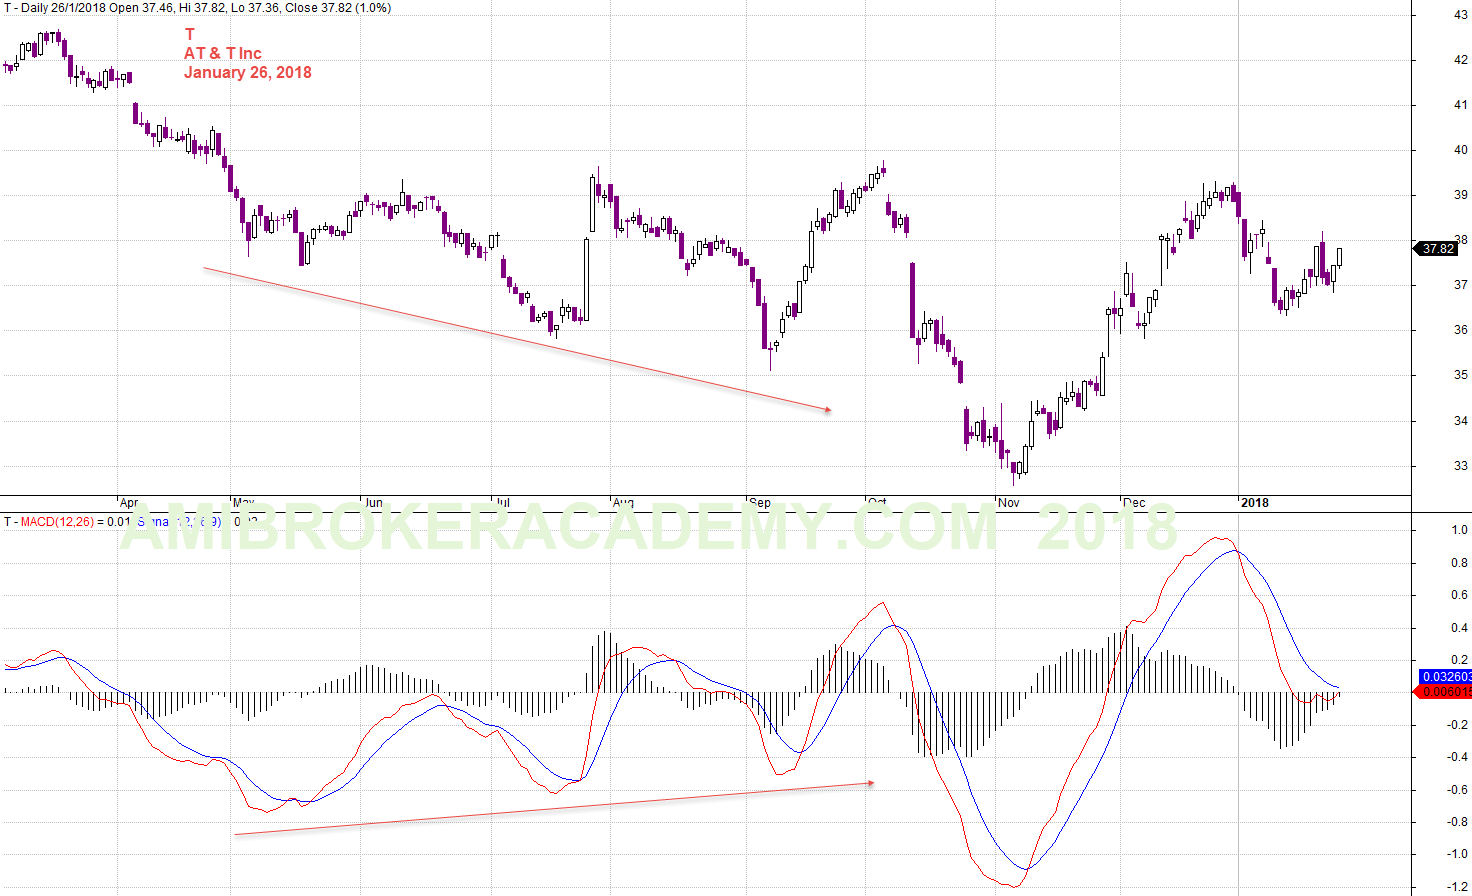
AT & T and MACD
We like to study the big big picture of a stock. And we like to use such as MACD to study the last six to ten months price action and the MACD signals.
Picture worth a thousand words, see trend or trading entry. Have fun!
January 26, 2018 AT & T and MACD
Moses
AmiBrokerAcademy.com
Disclaimer
The above result is for illustration purpose. It is not meant to be used for buy or sell decision. We do not recommend any particular stocks. If particular stocks of such are mentioned, they are meant as demonstration of Amibroker as a powerful charting software and MACD. Amibroker can program to scan the stocks for buy and sell signals.
These are script generated signals. Not all scan results are shown here. The MACD signal should use with price action. Users must understand what MACD and price action are all about before using them. If necessary you should attend a course to learn more on Technical Analysis (TA) and Moving Average Convergence Divergence, MACD.
Once again, the website does not guarantee any results or investment return based on the information and instruction you have read here. It should be used as learning aids only and if you decide to trade real money, all trading decision should be your own.