September 10, 2017
COMEX 2017 Singapore
The show in Singapore Suntec was just over. The show was on August 31 to September 3, 2017. MESH Wifi was one of the hot topics on network router, of course the Google Wifi was also the talk on the town. Google tie up with Starhub to deliver an exclusive offer to provide Google Wifi router. But, just one day before the tie up announcement, an fiber service provider roll out their COMEX show promotion with Google Wifi option. What an interesting arrangement! What exclusive, and so on.
The only thing is we never see Cisco router on the show floor. Why? Too expensive?
These days, we see new players like Asus and Google. Asus and Google have join the network competition. When will we see Amazon?
On the show, Asus has join the MESH Wift by offering ASUS Lyra Wi-Fi mesh networking system.
Will MESH the next Wi-Fi to stay? Will see.
Put technology aside. Let have a look at the Cisco stock price.
CSCO Cisco Systems Inc and Support Resistance
Picture worth a thousand words. $32 is an important level for the stock to take to the next height. 32 dollars has resisted Cisco to breakout higher since mid May to now. What a strong resistance to stop the stock price from moving higher.
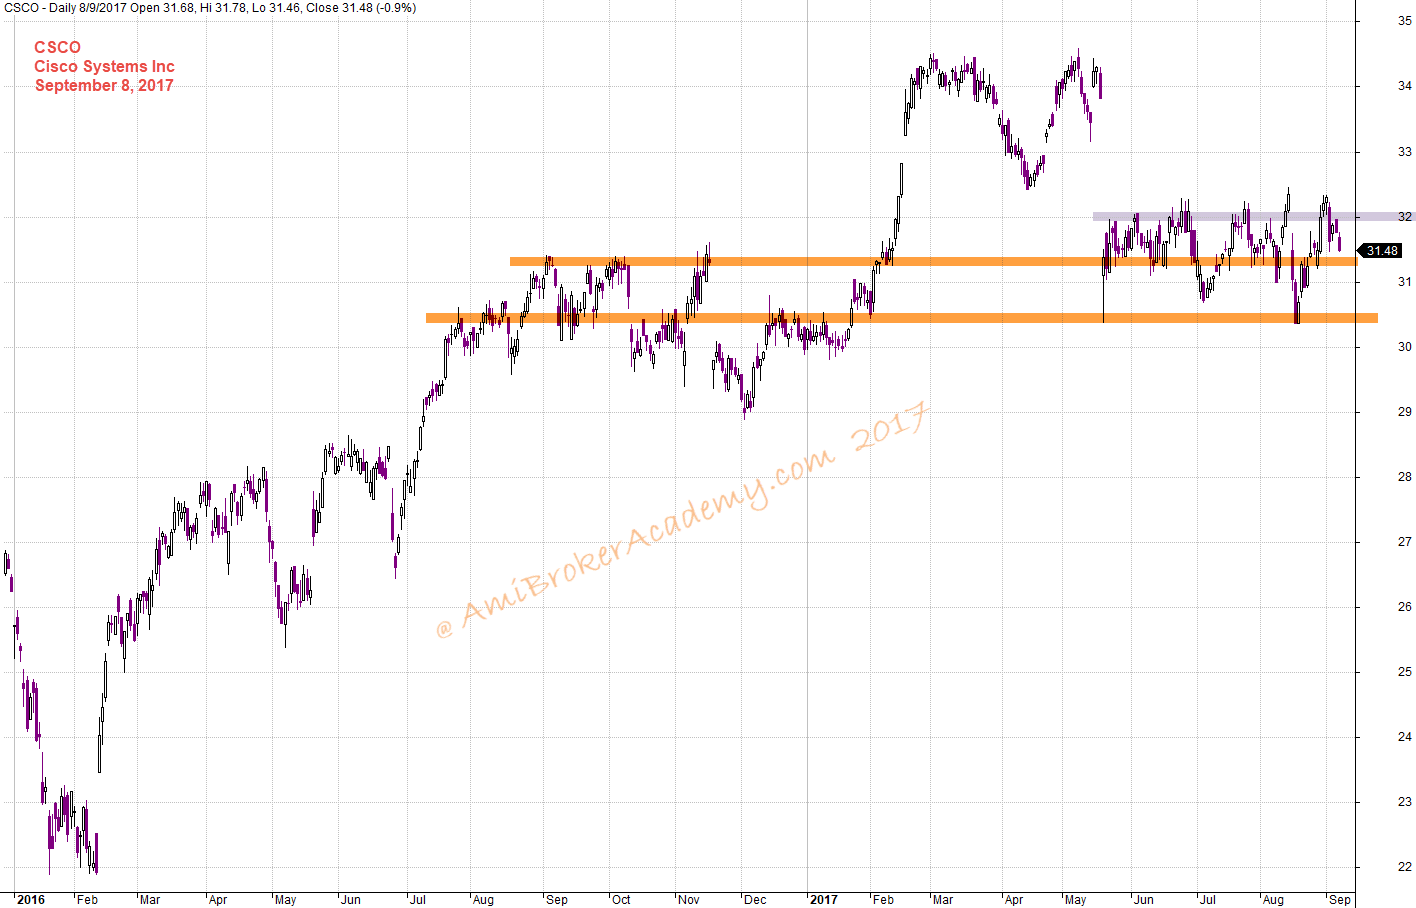
September 8, 2017 Cisco Systems Inc and Support Resistance
CSCO Cisco Systems Inc and Wave Count
Picture worth a thousand words, see chart for more. Remember no two Elliott Wave Engineer count the same. In fact, you could easily five another Elliott Wave count within an impulse wave. So, have fun!
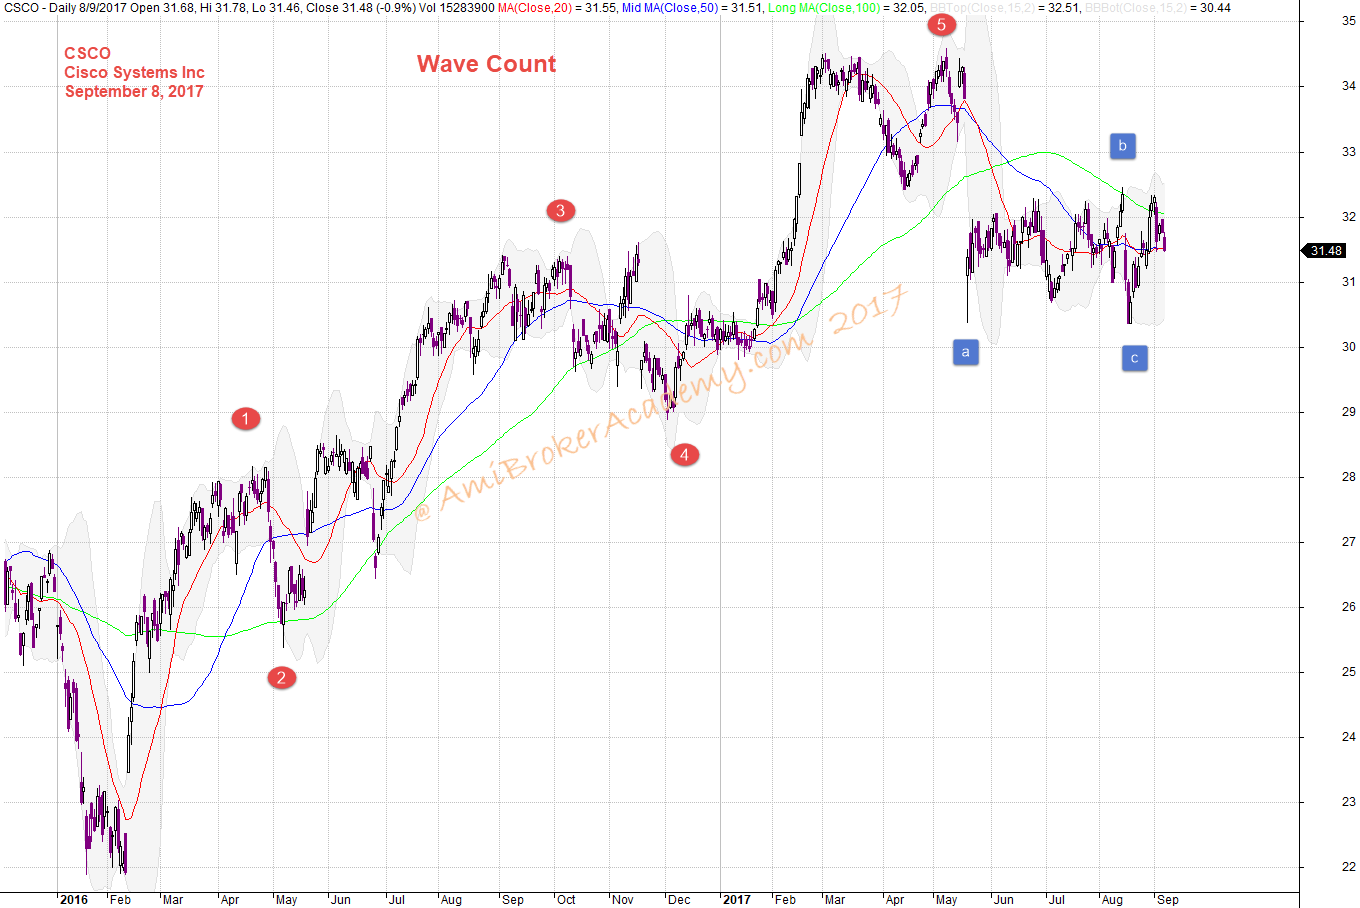
September 8,2017 Cisco Systems and Wave Count
CSCO Cisco Systems Inc and Channel
Picture worth a thousand words, see chart for more. Connect the low and copy and paste the trendline to the top, forms channel. The Channel is slopping from bottom left to top right. Bullish trend. But see the chart carefully, the price action is currently pullback and touching the bottom trendline.
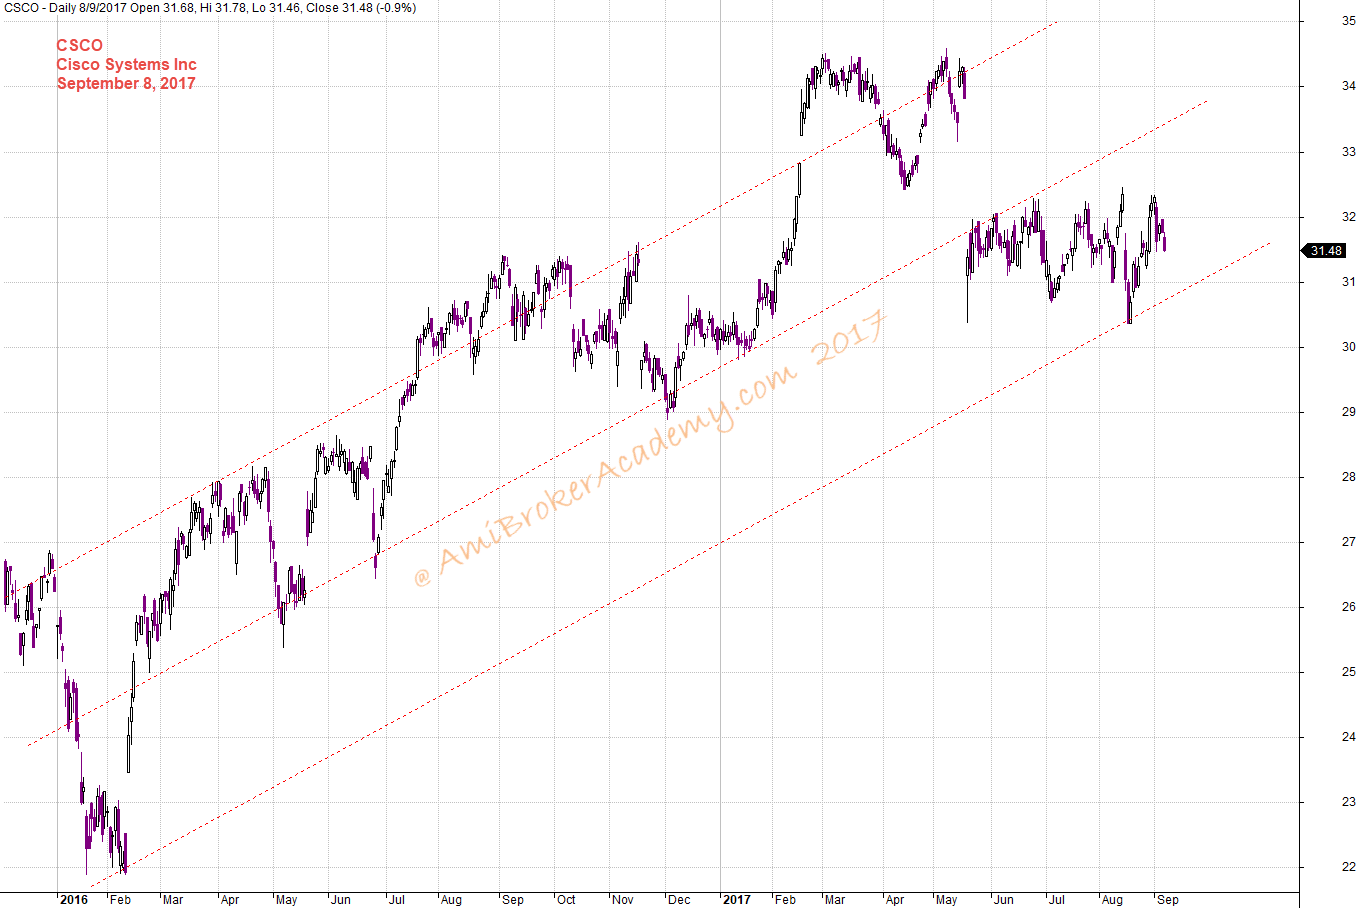
September 8, 2017 Cisco Systems and Channel
Thanks for visit the site here. You could also find free MACD scan here in this site too.
Moses
AmiBrokerAcademy.com
Disclaimer
The above result is for illustration purpose. It is not meant to be used for buy or sell decision. We do not recommend any particular stocks. If particular stocks of such are mentioned, they are meant as demonstration of Amibroker as a powerful charting software and MACD. Amibroker can program to scan the stocks for buy and sell signals.
These are script generated signals. Not all scan results are shown here. The MACD signal should use with price action. Users must understand what MACD and price action are all about before using them. If necessary you should attend a course to learn more on Technical Analysis (TA) and Moving Average Convergence Divergence, MACD.
Once again, the website does not guarantee any results or investment return based on the information and instruction you have read here. It should be used as learning aids only and if you decide to trade real money, all trading decision should be your own.