February 2, 2018
US Stock Analysis
TWTR Twitter Inc and MACD
See chart, the price action retested the 26, broke out the last high. Only until the price close above the 26 then can consider real bullish. Will see.
Manage your risk!
Powerful Chart Software – AmiBroker
The following chart is produced using AmiBroker charting software. It is a powerful chart software. You plot the stocks you are interested all in one chart, as long as you still could read them. See chart below.
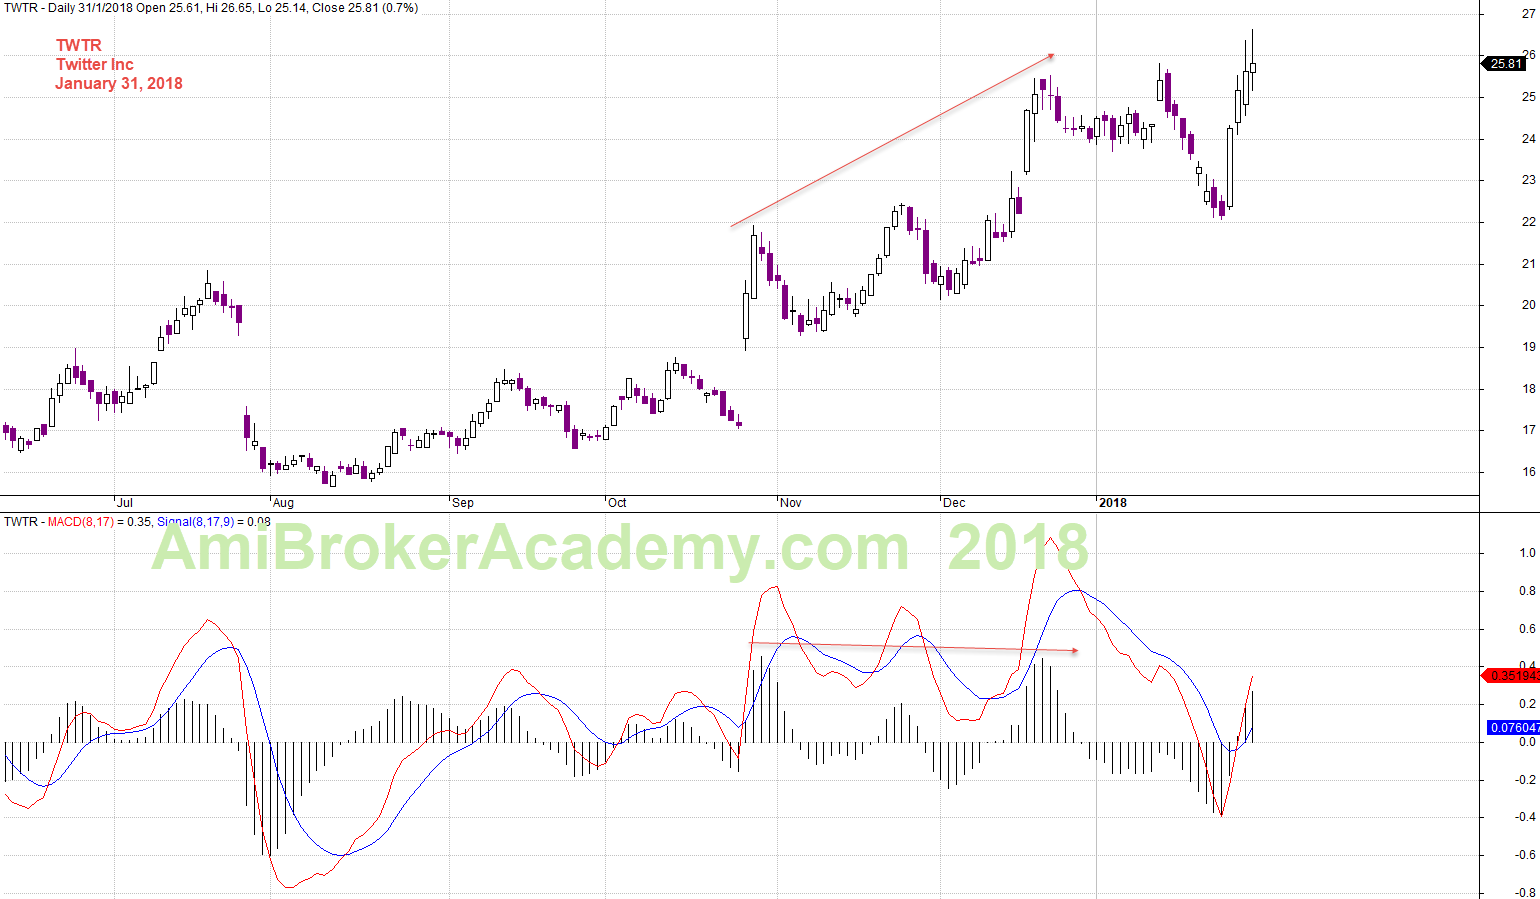
January 31, 2018 Twitter Inc and MACD
TWTR Twitter Inc Zoom Out
See chart, last four years (from 2014) see the quarter high low. The stock price went from as high as 75 to 15. The market seems to think the stock price is too high. Why?
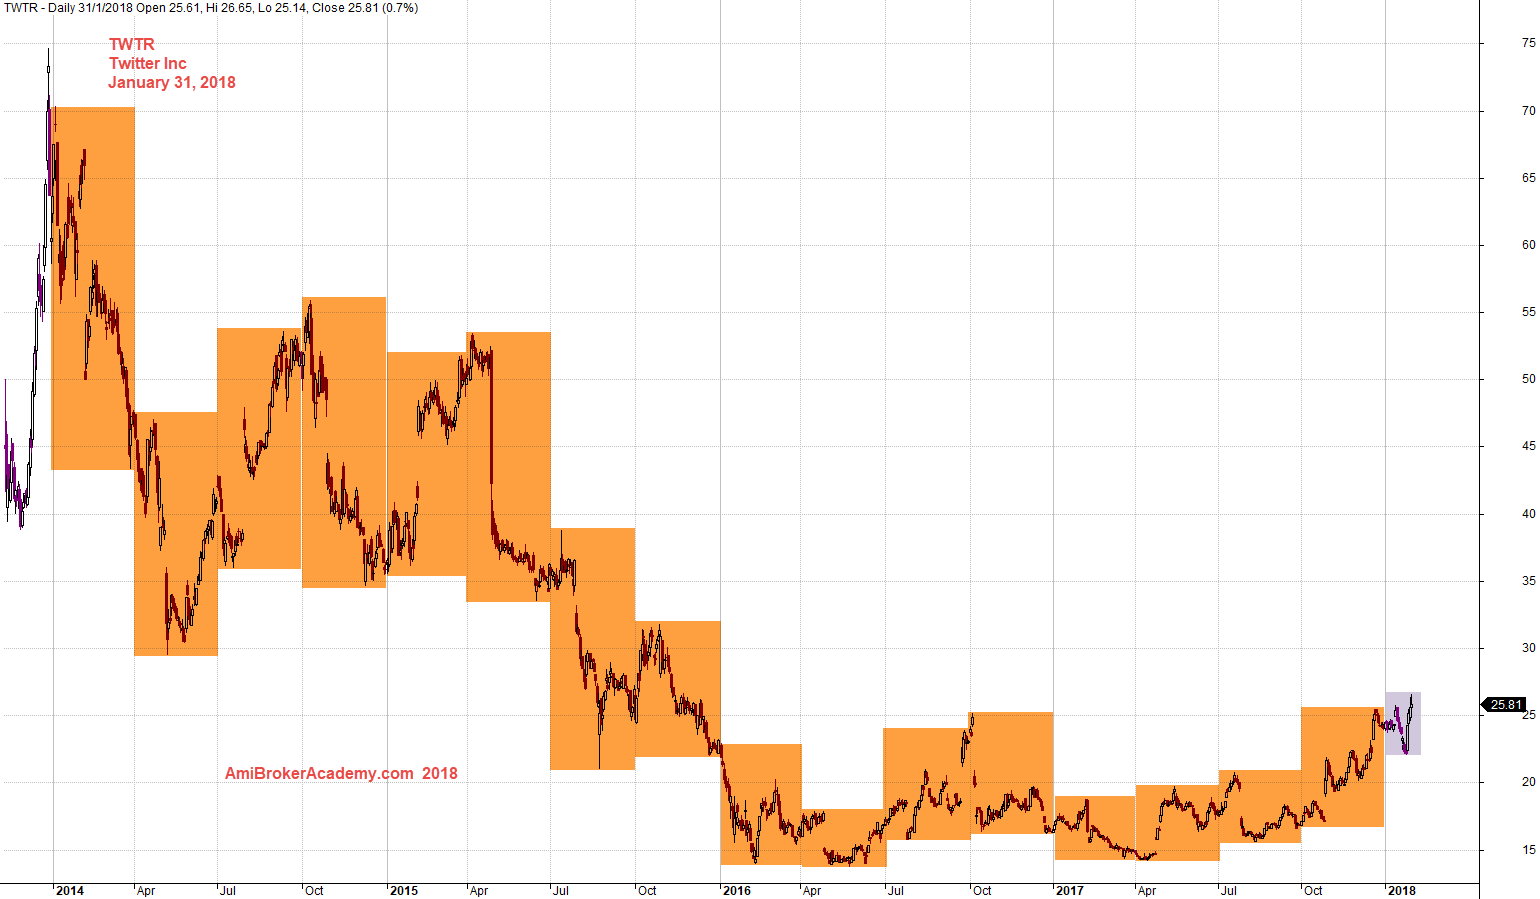
January 31, 2018 Twitter Inc Last Four Years Quarter High Low
TWTR Twitter Inc Zoom In
Price action test, retest the level 26. Can the stock price goes even higher? Will see.
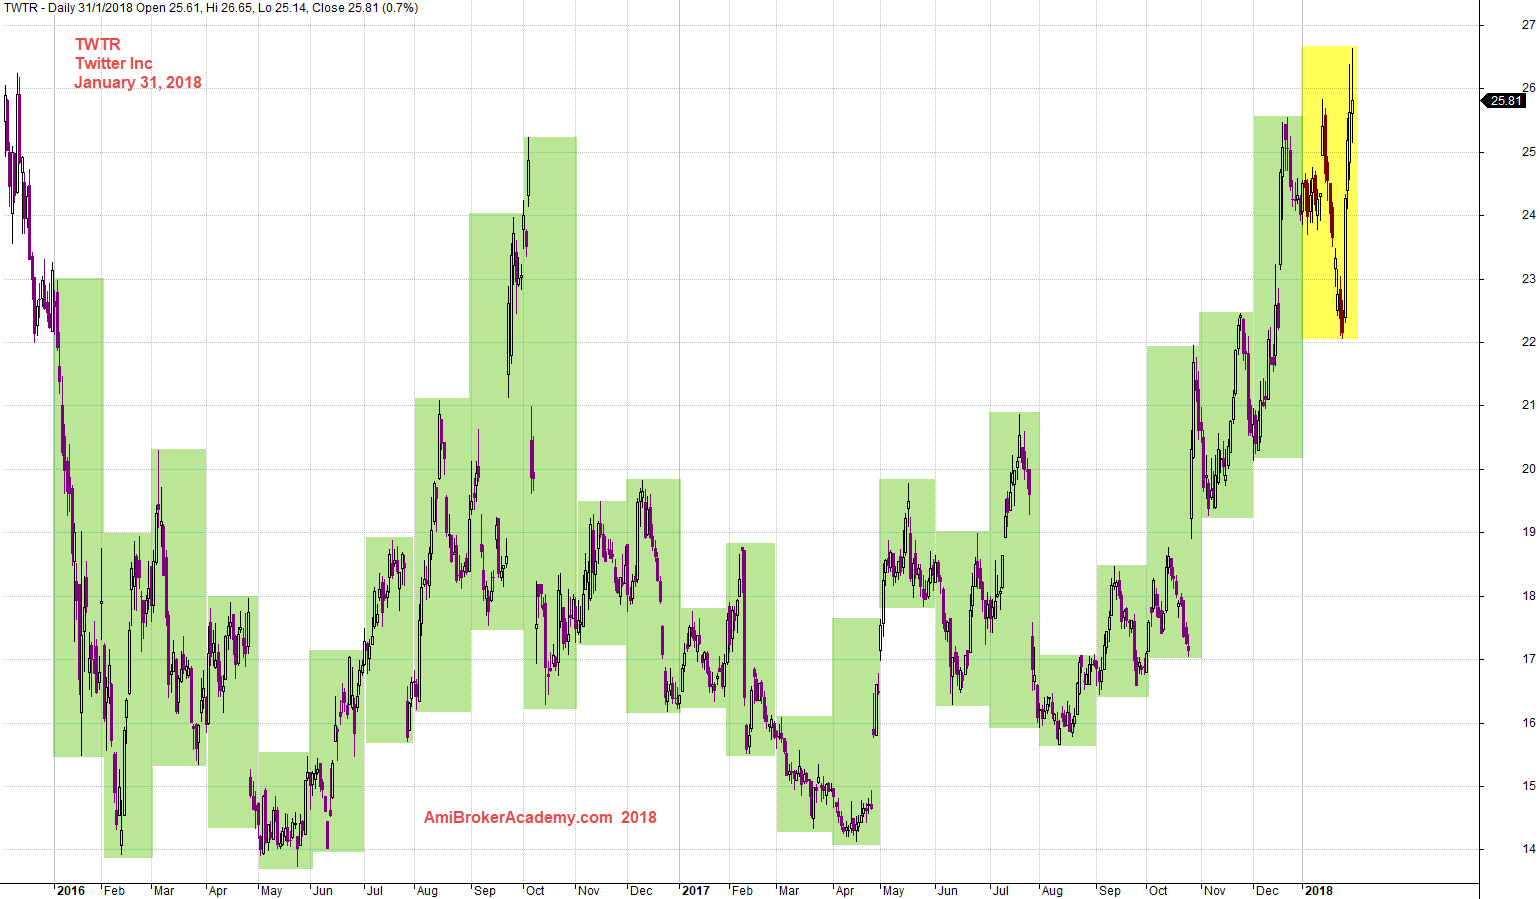
January 31, 2018 Twitter Inc Month High Low
Moses
AmiBrokerAcademy.com
Disclaimer
The above result is for illustration purpose. It is not meant to be used for buy or sell decision. We do not recommend any particular stocks. If particular stocks of such are mentioned, they are meant as demonstration of Amibroker as a powerful charting software and MACD. Amibroker can program to scan the stocks for buy and sell signals.
These are script generated signals. Not all scan results are shown here. The MACD signal should use with price action. Users must understand what MACD and price action are all about before using them. If necessary you should attend a course to learn more on Technical Analysis (TA) and Moving Average Convergence Divergence, MACD.
Once again, the website does not guarantee any results or investment return based on the information and instruction you have read here. It should be used as learning aids only and if you decide to trade real money, all trading decision should be your own.