November 28, 2017
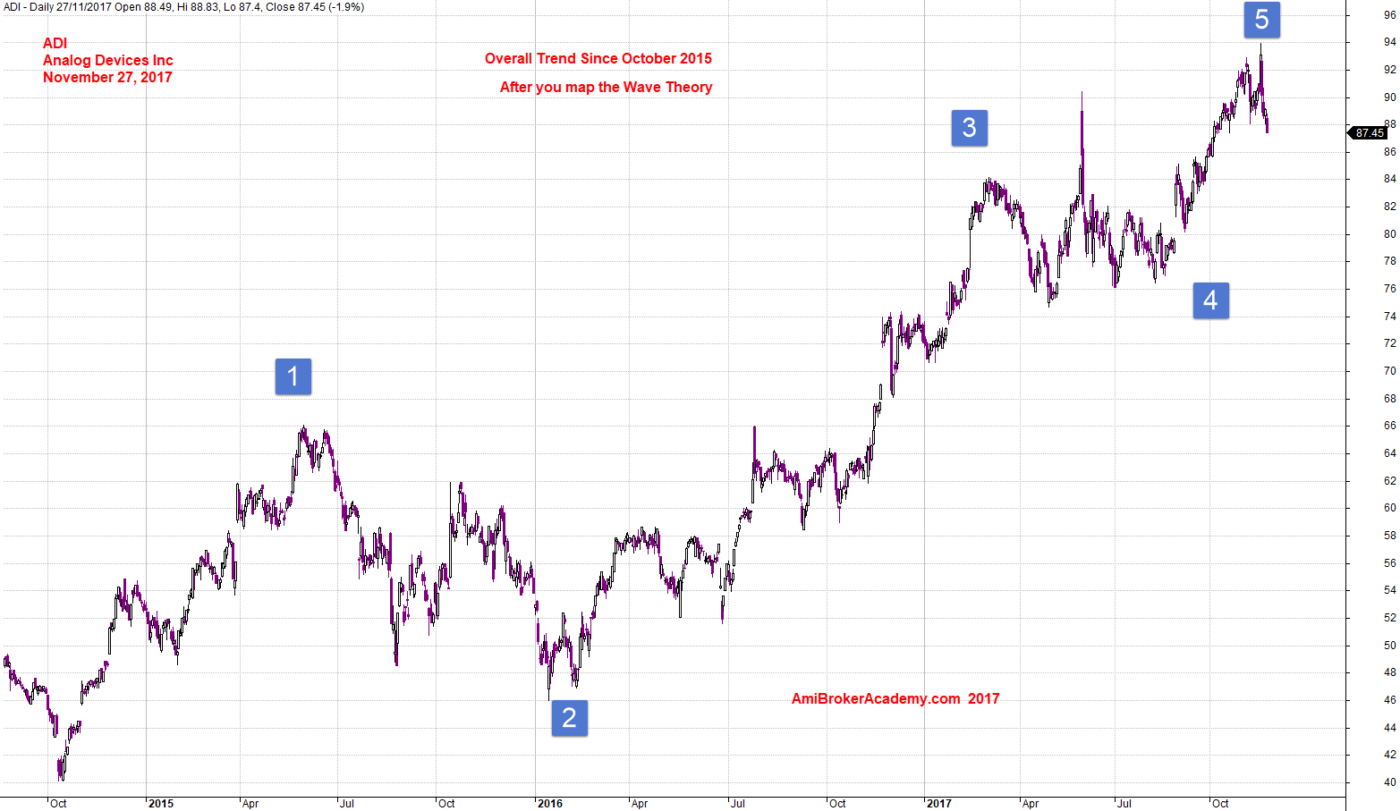
ADI Analog Devices Inc and Elliott Wave Count
Study chart from October 2015, after map wave count you can see the impulse wave and contraction wave. The stock price is still very very bullish.
94 dollars is a great high for 2017.
…
The following chart is plot by AmiBroker charting software. AmiBroker is a powerful charting software.
November 27, 2017 Analog Devices Inc and Wave Count
ADI Analog Devices Inc and Resistance Study
The trend is very bullish, study the resistance. You see the level is always retested before broken.
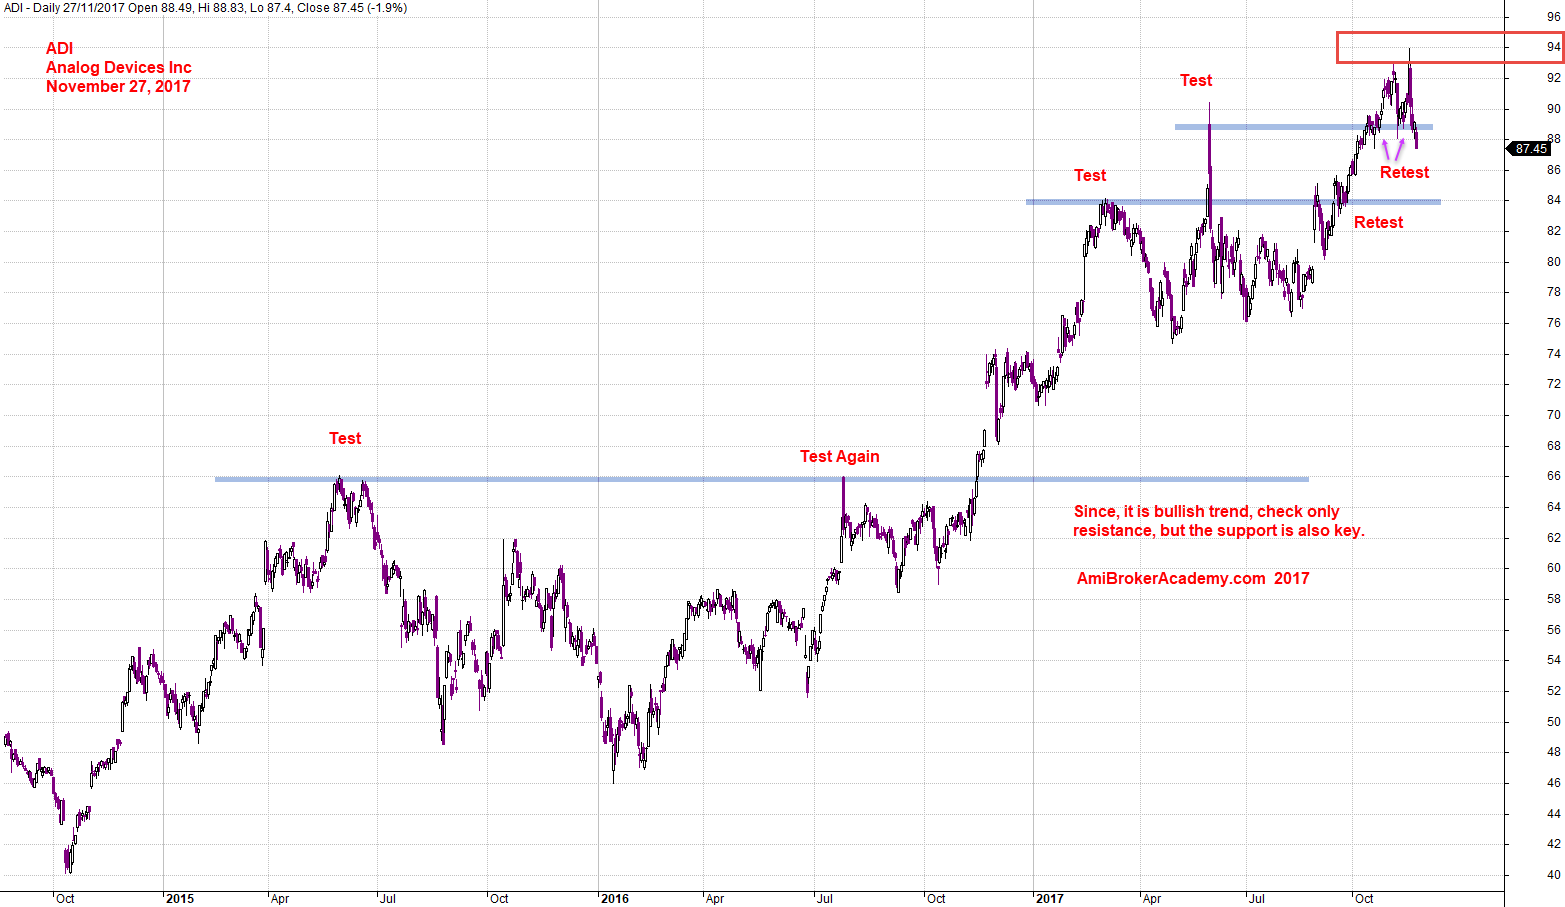
November 27, 2017 Analog Devices Inc and Resistance Study
Moses
AmiBrokerAcademy.com
Disclaimer
The above result is for illustration purpose. It is not meant to be used for buy or sell decision. We do not recommend any particular stocks. If particular stocks of such are mentioned, they are meant as demonstration of Amibroker as a powerful charting software and MACD. Amibroker can program to scan the stocks for buy and sell signals.
These are script generated signals. Not all scan results are shown here. The MACD signal should use with price action. Users must understand what MACD and price action are all about before using them. If necessary you should attend a course to learn more on Technical Analysis (TA) and Moving Average Convergence Divergence, MACD.
Once again, the website does not guarantee any results or investment return based on the information and instruction you have read here. It should be used as learning aids only and if you decide to trade real money, all trading decision should be your own.